Journal of Biomedical Engineering and Biosciences (JBEB)
ISSN: 2564-4998

Volume 12 - Year 2025 - Pages 18-27
DOI: 10.11159/jbeb.2025.003
Automatic Protein Recruitment Detection and Calcium Response Analysis after Laser-Induced Damage in Live Cells Using Machine Learning-Based Image Processing Pipelines
Connor Lee¹†, Harvy Chang¹†, Hongyi Niu², Albert Li¹†,Chengbiao Wu2, Veronica Gomez-Godinez¹, Linda Shi¹
1University of California San Diego, Institute of Engineering in Medicine
9500 Gilman Dr, La Jolla, CA, USA 92093
gomezvg@gmail.com; zshi@ucsd.edu
2University of California San Diego, Department of Neuroscience Biology
9500 Gilman Dr, La Jolla, CA, USA 92093
chw049@health.ucsd.edu
†High school students participating in the IEM OPALS program
cl34953@pausd.us; harvychang0720@gmail.com; hongyi.niu@gmail.com; albertli07819@gmail.com
Abstract - Machine learning (ML) has been successfully applied across numerous disciplines to enhance efficiency and accuracy; however, most biological research laboratories continued to rely heavily on manual image processing approaches. While expert analysis was essential during the early experimental stages, the availability of sufficient datasets allowed ML algorithms to significantly accelerate image analysis and reduce human error. This motivation led to the development of a machine learning–based image processing pipeline for biological imaging applications. An ML framework integrating Cellpose-based segmentation with Python automation was implemented and applied to four major areas: protein recruitment following DNA double-strand breaks (DSBs), calcium flux tracking in cortical neurons after laser-induced shockwave (LIS) injury, calcium response characterization in retinal ganglion cells (RGCs), and comparative calcium dynamics in Alzheimer’s disease (AD) cellular models. Controlled DSBs were introduced into U2OS cells by a robotic laser microscope system (Robolase), with proteins of interest labeled using green fluorescent protein (GFP). Sequential fluorescence images were acquired and processed through custom Python code. The algorithm automatically detected protein recruitment by quantifying GFP intensity changes over time and generated kinetic plots within minutes. Minimal code modifications allowed the pipeline to be extended to calcium flux analyses in neurons, RGCs, and AD-affected cells. The automated pipelines considerably shortened the image processing time compared with manual methods, while maintaining high precision and scalability across biological applications. These findings demonstrated the potential of ML-enhanced imaging pipelines to advance studies of DNA damage repair, traumatic brain injury (TBI) modeling, and neurodegenerative disease.
Keywords: DNA Damage Repair, Laser Ablation, Laser-Induced Shockwave, Calcium Imaging, Retinal Ganglion Cells, Alzheimer’s Disease, Cellpose, Automated Analysis.
© Copyright 2025 Authors This is an Open Access article published under the Creative Commons Attribution License terms. Unrestricted use, distribution, and reproduction in any medium are permitted, provided the original work is properly cited.
Date Received: 2025-04-08
Date Revised: 2025-09-11
Date Accepted: 2025-09-24
Date Published: 2025-10-30
1. Introduction
The elucidation of the DNA double helix structure by Watson and Crick marked a turning point in the understanding of genetic material and emphasized its vulnerability to damage. Foundational studies by Meselson and Stahl established the principles of DNA replication and repair [1]. In the 1970s, Berns and colleagues introduced laser ablation as a highly precise method to induce cellular-level damage [2], enabling controlled studies of biological injury [3]. Subsequent advancements in laser technology and live-cell imaging techniques allowed real-time monitoring of DNA repair processes, providing deeper insights into molecular mechanisms following double-strand breaks (DSBs) [4–11].
Despite these technological advances, the analysis of large-scale time-lapse fluorescence imaging data remained labor-intensive, error-prone, and highly variable when performed manually. This limitation created a critical demand for automated, efficient, and reproducible methods. The integration of machine learning (ML) algorithms offered a promising solution by combining speed, accuracy, and scalability. In this study, an ML-driven image analysis framework was implemented to substantially accelerate data processing while maintaining reproducibility and precision.
In parallel, laser-induced shockwaves (LIS) were increasingly employed as a model for traumatic brain injury (TBI), a condition of high relevance in both military and sports medicine. Investigations into blast-related TBI dated back to the 1950s [12], evolving into extensive molecular and cellular studies over subsequent decades [13–14]. Initially developed for clinical applications such as gallstone lithotripsy [15], shockwave technology was later adapted to examine neural tissue injury, highlighting the importance of Ca²⁺ signaling mediated by cavitation microbubbles [16]. A specialized LIS system was developed in the Biophotonics Laboratory at UC San Diego to simulate blast-induced conditions at the cellular level, enabling detailed studies of neuronal and astrocytic calcium responses [17].
Traditional manual quantification of calcium fluctuations was inefficient and inconsistent. To overcome these limitations, the ML framework originally designed for DNA repair analysis was adapted to LIS experiments, integrating Python-based automation with advanced segmentation methods to enable rapid and precise quantification of calcium dynamics in cortical neurons and retinal ganglion cells (RGCs).
Importantly, the same framework was further extended to neurodegenerative disease models where multiple fluorescence channels were required. In these cases, the pipeline was applied not only to monitor calcium flux before and after laser damage but also to relate the observed responses to cell survival status. In particular, calcium dynamics in mouse primary cortical neurons with and without Alzheimer’s disease were analyzed following LIS. Because cortical neurons are especially vulnerable to dysfunction in Alzheimer’s disease, this application provided key insights into early functional deficits associated with disease progression. While neuronal calcium transients were traditionally analyzed using MATLAB-based methods—often unstable, error-prone, and requiring extensive manual masking—the automated Python workflow enabled efficient, reliable, and reproducible analysis across multi-channel datasets.
Beyond the technical details, the workflow was built for typical biomedical labs. It can run on a standard desktop, use open-source Python tools, and turn what hours of manual tracing were into minutes of automated analysis. The same code can be pointed at common image formats and adapted with small edits for related assays.
2. Materials and System Setups
2. 1. Laser Ablation System Setup
A tunable femtosecond mode-locked Ti:Sapphire infrared laser (Mai Tai, Spectra-Physics, Newport Corp., Mountain View, CA) was used to generate the laser-induced microirradiation for precise subcellular targeting. Laser power was attenuated via a motorized rotating optical polarizer (Newport, Irvine, CA), and pulse delivery was controlled by a mechanical shutter (Vincent Associates, Rochester, NY) with a 10 ms duty cycle. The laser beam was expanded to fill the back aperture of a 100× NA 1.3 Zeiss objective mounted on a Zeiss Axiovert 200M microscope and focused on the sample. Two-photon excitation was employed at either 730 nm (effective 365 nm) or 800 nm (effective 400 nm) with laser powers of 50 mW and 60 mW, respectively, measured before entering the phase contrast objective. A custom-built Labview APP was programmed to facilitate high-resolution, real-time, live-cell imaging.
2.2 U2OS Cell Lines for DNA Repair Study
The preparation of U2OS (human osteosarcoma) cell lines was described previously in [18]. U2OS cells were obtained from the American Type Culture Collection (ATCC) cell repository. RPE-1 WT cells were received from Dr. Stephen P. Jackson’s lab. UWB1 and UWB1 reconstituted with BRCA1 cells were received from Dr. Lee Zou’s lab. Cells were cultured in Dulbecco’s modified Eagle’s medium (DMEM; Gibco) supplemented with 10% fetal bovine serum (FBS; GeminiBio.), 2mM L-glutamine (Sigma-Aldrich), and 1% penicillin-streptomycin containing glutamine (Gibco) at 37 °C in a humid atmosphere containing 5% CO2. The U2OS (EGFP-HR/STGC) reporter cell line was generated by the transfection of the EGFP-HR/STGC reporter into U2OS cells with polyethylenimine (PEI) using the standard protocol, followed by hygromycin B (100 µg/ml) selection. Double-strand breaks (DSBs) were introduced in live-cell nuclei through precision laser-induced microirradiation.
2. 3. Laser-Induced Shockwave System Setup
A Coherent Flare 532 nm laser system (100 Hz repetition rate, 2 ns pulse width, 450 μJ pulse energy; Spectra-Physics, Mountain View, CA) was used to generate localized shockwaves. Laser power was attenuated via a motorized rotating optical polarizer (Newport, Irvine, CA), and pulse delivery was controlled by a mechanical shutter (Vincent Associates, Rochester, NY) with a 10–15 ms duty cycle. The laser beam was expanded to fill the back aperture of a 40× NA 1.3 Zeiss objective mounted on a Zeiss 200M microscope and focused 10 μm above the substrate. The incident power measured before the objective was approximately 200–220 μW. A Zeiss filter set 48 (436/20 nm excitation, 455 nm long-pass dichroic mirror) was installed, with additional emission filters (535/30 nm for FRET, 480/40 nm for ECFP) mounted on a LUDL motorized filter wheel, positioned before an ORCA-Flash4.0 V2 Hamamatsu CMOS camera for fluorescence imaging.
2.4 Preparation for Cortical Neurons and RGC
Mouse primary cortical neurons were cultured as described in (Gu et al., DOI: 10.1016/j.nbd.2024. 106502). Cells were preloaded with Fluo-4 AM [17] to study calcium flux. LIS creates a cavitation bubble that expands and rapidly collapses, causing subsequent death to cells in the bubble's vicinity. A 1032 nm laser was focused 10 µm above the substrate, which contained the neurons.
RGCs from postnatal (5 days) Sprague-Dawley rats were purified by immunopanning, separated, and cultured in a serum-free defined growth medium containing BDNF, CNTF, insulin, and forskolin. RGCs were dyed with Fluo-4, a calcium indicator. Fluorescence images were taken every 10 seconds for 5-25 minutes. The axon of an individual cell was then damaged by a 275 µW laser 20 μm away from the cell soma.
3. Results and Discussions
3.1 Machine Learning-Driven Image Analysis for DNA Repair Dynamics Post-Laser Ablation
One of the major bottlenecks traditionally encountered in live-cell DNA repair imaging was the labor-intensive task of manually analyzing hundreds to thousands of time-lapse fluorescence images to capture subtle recruitment events of repair proteins following laser ablation. To address this limitation and expedite the data analysis process, a robust machine learning pipeline was designed and adapted, building on the capabilities of Cellpose [19], a state-of-the-art deep learning segmentation framework in computational biology.
A significant advancement was achieved by integrating automated cell detection, repair line identification, and intensity quantification into a single streamlined system. Multiple available methods from online repositories, published literature, and GitHub resources were extensively evaluated, and Cellpose was identified as the most versatile. The pre-trained convolutional neural networks (CNNs) in Cellpose were customized to specifically address the challenges associated with dynamic protein recruitment analysis following DNA damage.
The workflow proceeded as follows:
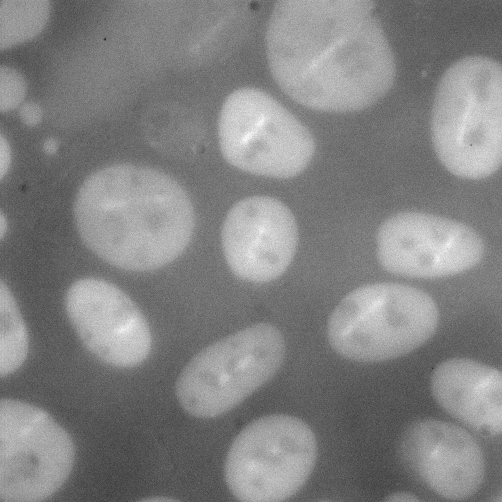
- Batch Image Loading: Sequential fluorescence images capturing the recruitment of repair proteins were loaded for processing. These time-lapse datasets represented the dynamic behavior of protein of interest at the sites of laser-induced DNA double-strand breaks as shown in Figure 1
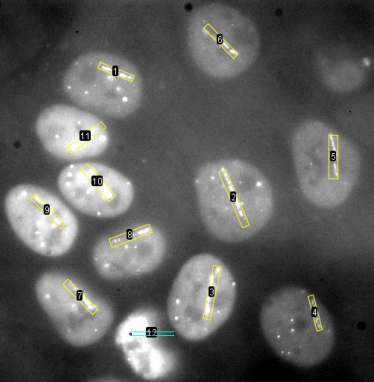
- Automated Cell Segmentation: Each image underwent automated segmentation through Cellpose, which generated accurate cell masks and delineated nuclear boundaries with minimal manual intervention as shown in Figure 2.
- Cropped Region Extraction: Using the segmentation masks, individual cells were cropped and saved for high-precision analysis of protein recruitment.
- Recruitment Line Detection: The brightest pixel within each cropped cell was automatically identified as the initial recruitment signal at the laser cut site as shown in Figure 3
- Thresholding and Binary Mask Creation: Cropped images were normalized, thresholded, and converted into binary masks using OpenCV libraries, thereby improving signal-to-noise ratios and enhancing recruitment site visibility.
- Contour Detection and Line Segmentation: Contours were detected, and the laser-induced cut line was delineated by connecting the two farthest points on the contour. This enabled precise spatial mapping of the recruitment process as shown in Figure 4.
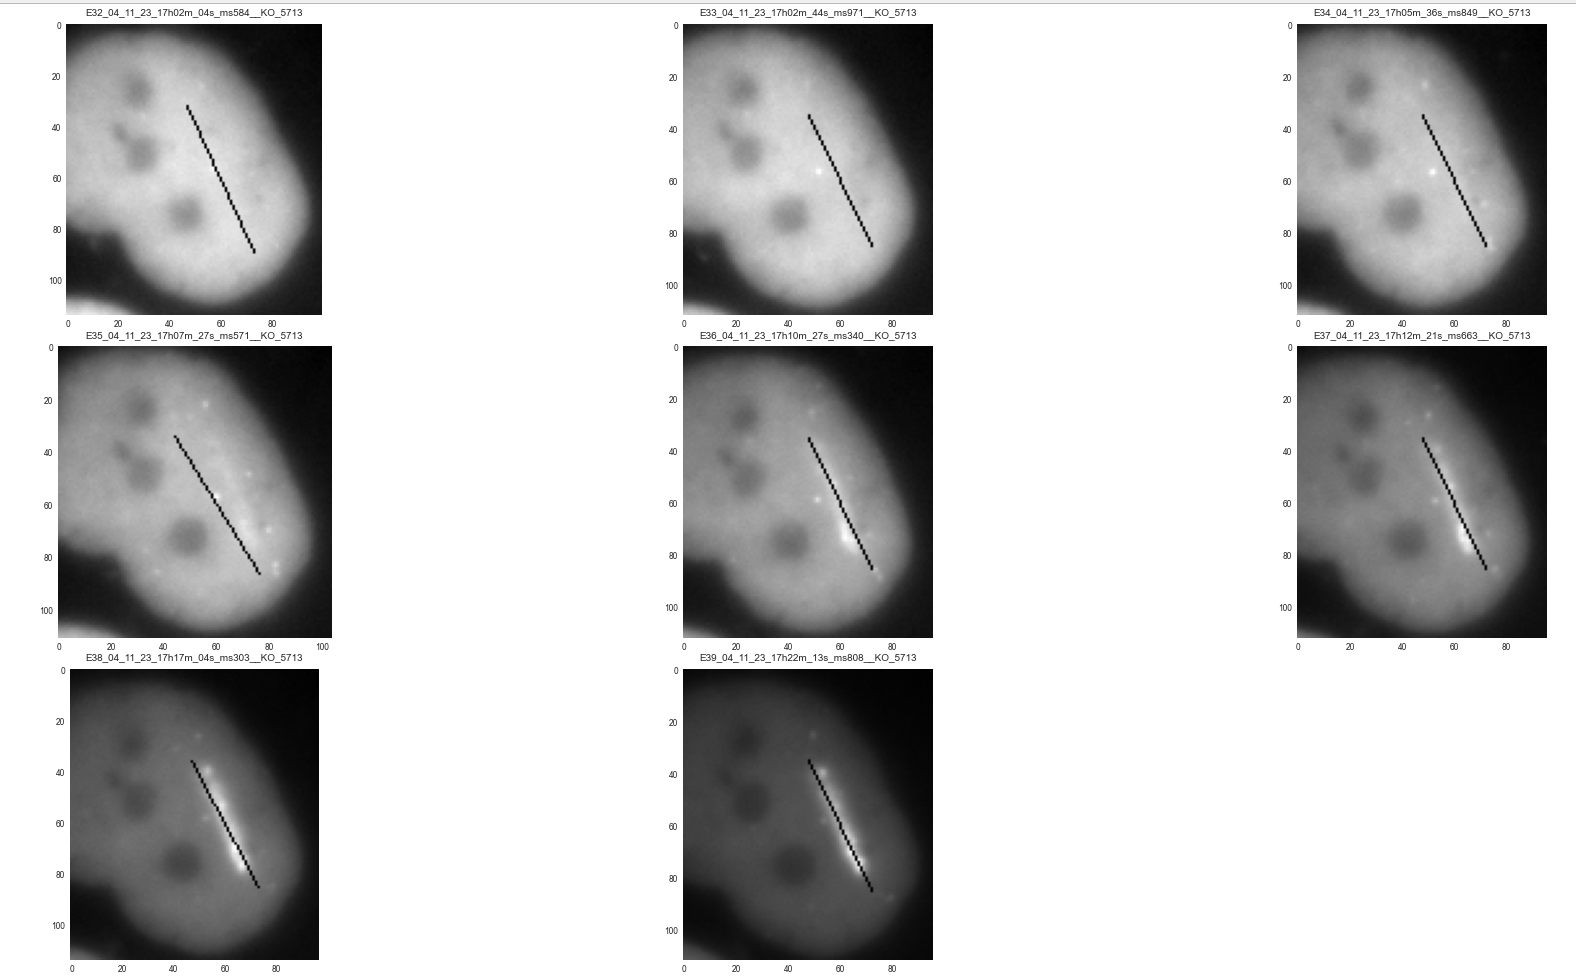
- Quantitative Intensity Measurement: The mean fluorescence intensity along the laser cut line was calculated over time, providing a direct quantitative assessment of protein recruitment dynamics as shown in Figure 5.
- Data Export and Visualization: All quantified results were exported into structured CSV files, and fluorescence intensity plots were generated using Python-based visualization tools such as Matplotlib.
This machine learning–driven pipeline not only reduced analysis time from several hours to a matter of minutes per dataset but also eliminated subjective bias associated with manual scoring. Furthermore, the framework demonstrated scalability, as the same code base could be adapted to additional cell types and experimental conditions with minimal modification.


3.2 Automated Image Processing of Cortical Cells Calcium Responses After Laser-Induced Shockwave Injury
Building upon the expertise developed in automating DNA repair imaging analysis, the machine learning–driven methods were extended to two additional biological applications: the quantitative analysis of calcium dynamics in cortical neurons and retinal ganglion cells (RGCs) following laser-induced shockwave (LIS) injury. This extension represented a natural progression, as it leveraged the strengths of automated image segmentation and intensity quantification techniques to address another biologically complex problem.
LIS systems simulated localized mechanical injuries at the cellular level, enabling the study of intracellular calcium fluxes, which served as critical early indicators of neuronal and astrocytic responses under traumatic brain injury (TBI) conditions. Manual analysis of the large volumes of time-lapse imaging data generated from these experiments was highly impractical and prone to observer bias. Consequently, an automated workflow was designed to systematically extract, quantify, and visualize calcium response patterns across hundreds of cells over multiple frames.
The workflow for LIS data analysis consisted of several key steps:
- Brightest Frame Indexing: The image series was scanned to identify the frame with the highest overall fluorescence intensity, which marked the initiation of the shockwave effect (Figure 6).
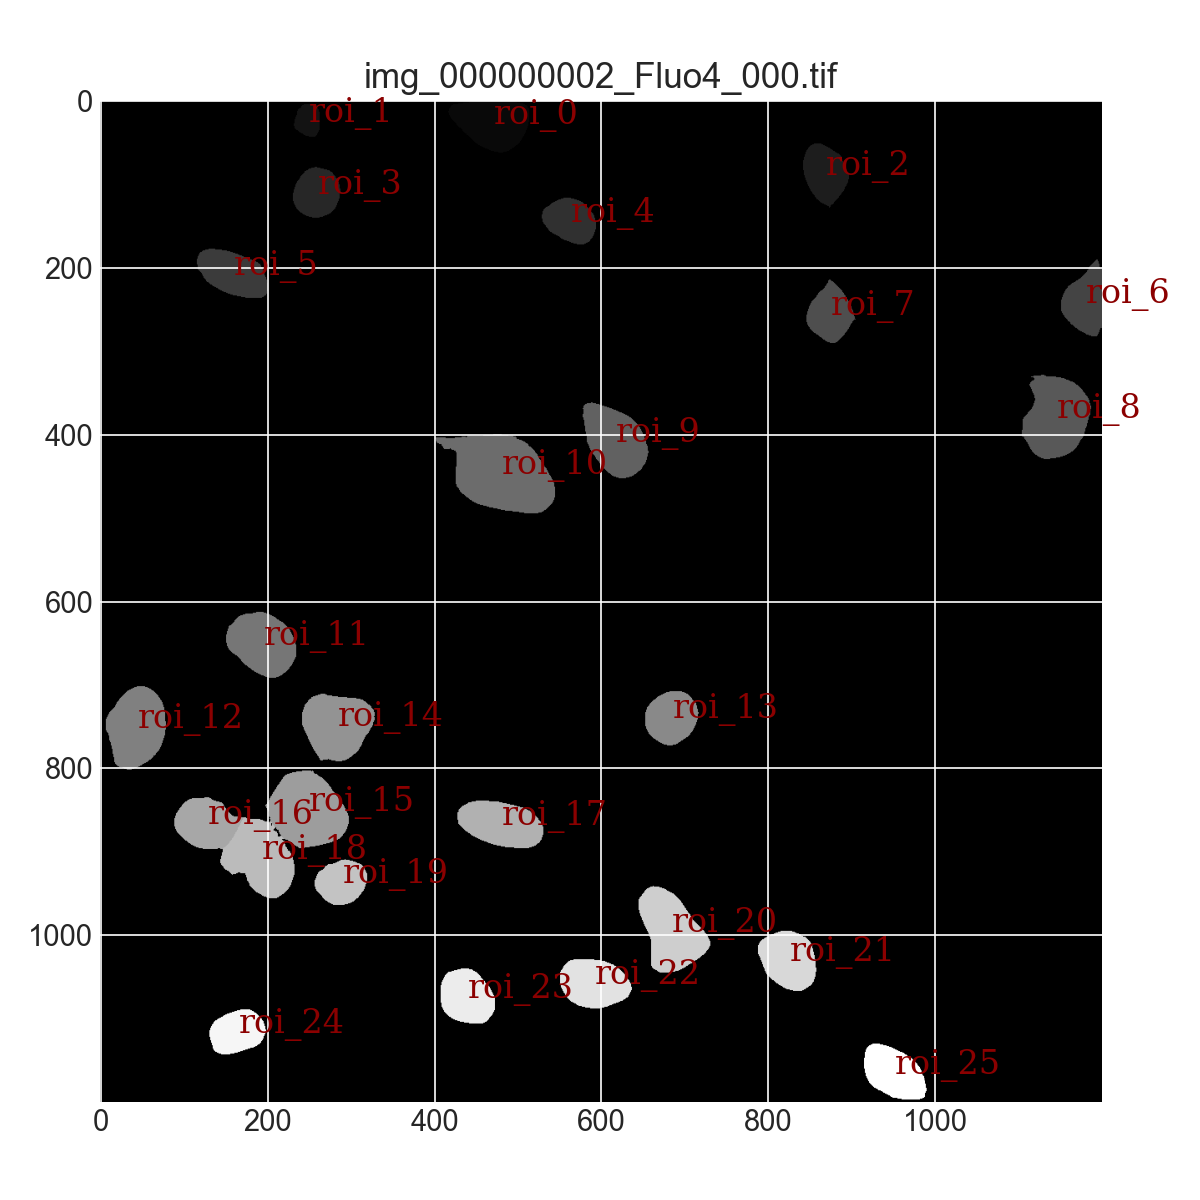
- Automated ROI (Region of Interest) Segmentation: Cells were automatically segmented from the frame containing the peak fluorescence signal. Algorithms adapted from DNA repair studies were employed to delineate each cell as an individual ROI, allowing targeted intensity tracking (Figure 7)
- Temporal Tracking of Cellular Response: Fluorescence intensity for each segmented ROI was measured and recorded across all frames, capturing the temporal evolution of calcium responses at the single-cell level.
- Batch Processing of Multiple ROIs: All ROIs and frames were processed in batch mode, enabling time-resolved fluorescence traces to be compiled automatically for large populations of cells with minimal manual input.
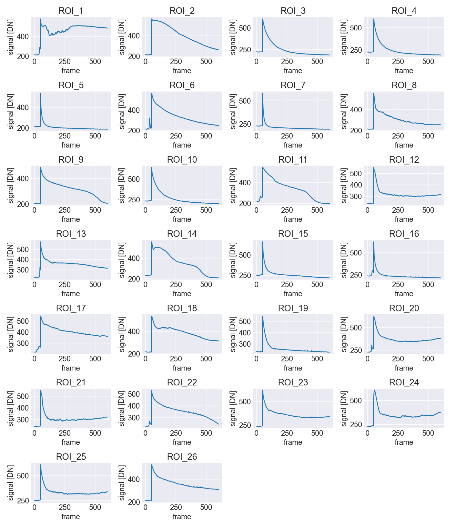
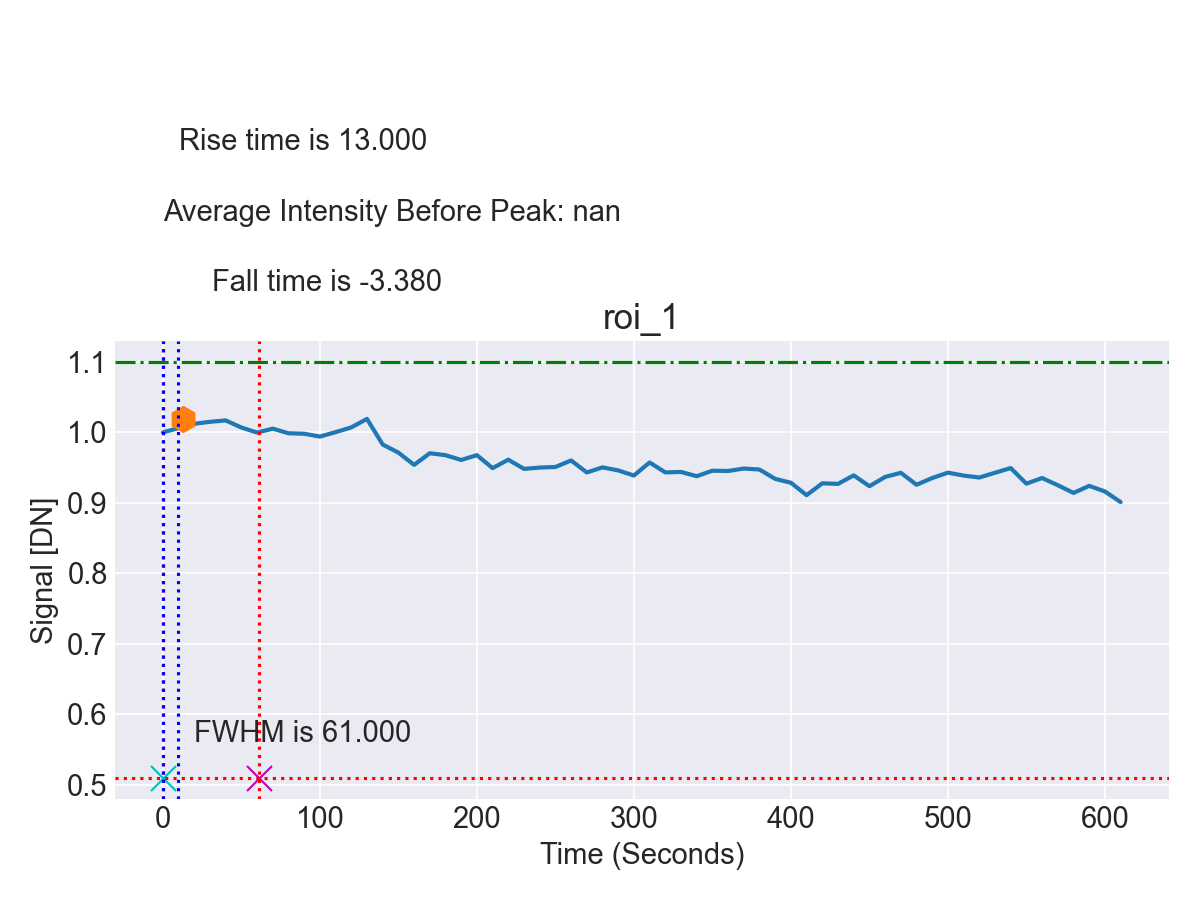
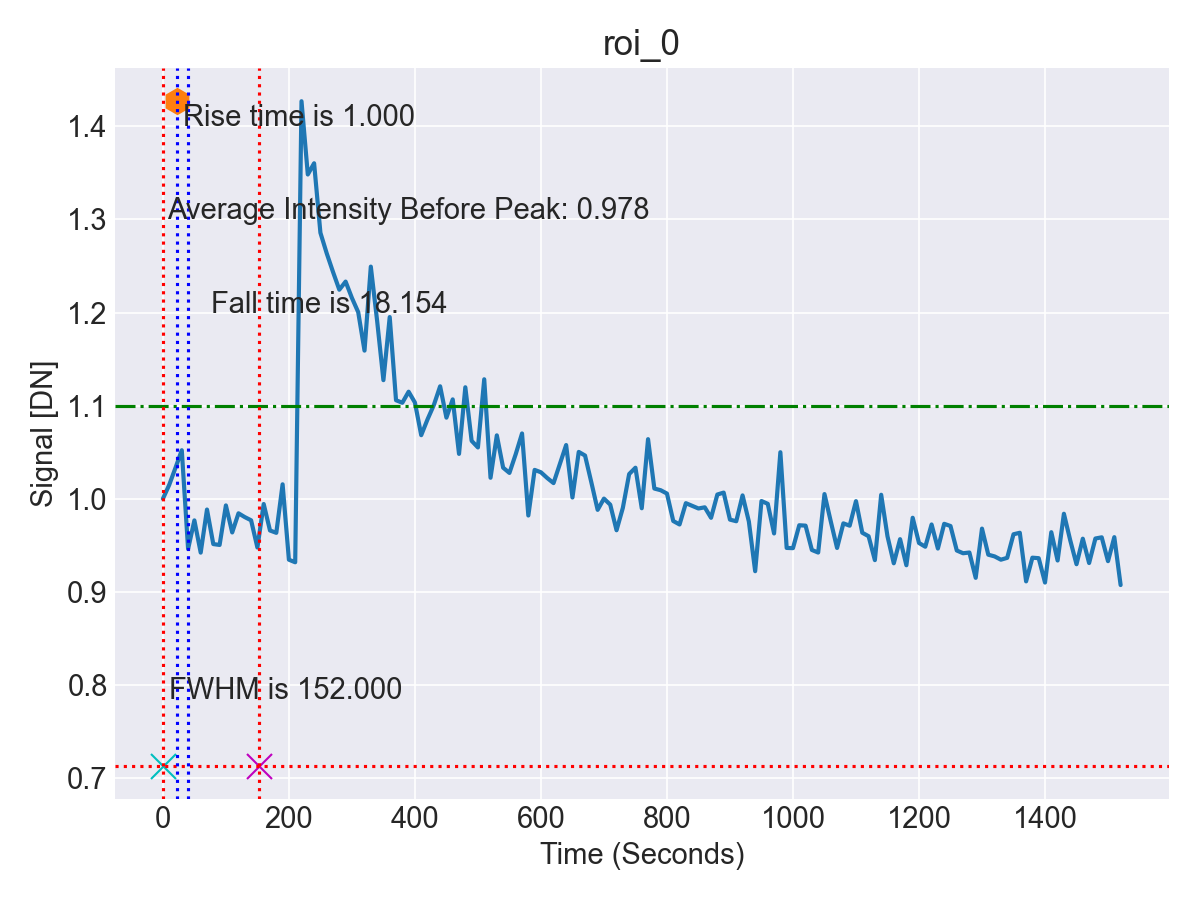
- Quantitative Data Output and Visualization: The intensity trajectories for each cell were exported into structured CSV datasets for downstream statistical analysis. Visualization tools such as Matplotlib were used to generate comprehensive response curves, facilitating interpretation of calcium dynamics following LIS (Figure 8).
This automated pipeline markedly accelerated the analysis process, reducing what had previously required hours of manual tracing per dataset to only a few minutes of computation. At the same time, accuracy and reproducibility were maintained, thereby enabling efficient and scalable analysis of calcium dynamics in neuronal and RGC models subjected to traumatic injury.


3.3 Automated Image Processing of RGC Calcium Responses After Laser ablation and LIS
To further evaluate the effectiveness and robustness of the proposed algorithms in broader biological applications, calcium imaging datasets of retinal ganglion cells (RGCs) before and after laser ablation and LIS exposure were processed and analyzed. As shown in Figure 9, RGCs were successfully segmented and masked automatically using the same algorithmic framework previously applied to cortical cells.
Representative calcium intensity traces from three randomly selected RGCs were used to demonstrate the system’s performance under different experimental conditions (Figures 10–12):
- Control Condition (No Laser Ablation or LIS): Calcium intensity remained relatively stable over a 10-minute observation period (Figure 10). This condition served as the baseline to validate the algorithm’s accuracy in detecting true fluctuations.
- Laser Ablation: A pronounced calcium spike (~40% increase) was detected immediately after laser ablation, followed by a gradual return to baseline levels within approximately 10 minutes (Figure 11).
- Laser-Induced Shockwave (LIS): Calcium intensity increased more than two-fold following LIS exposure and then exhibited a continuous decline over the subsequent 25 minutes (Figure 12).
The Python codes used for cortical neuron analysis were applied directly, with only minor modifications introduced to convert the x-axis from frames to time in minutes. This demonstrated that the pipeline could be readily adapted for use across different cell types with minimal adjustments. Importantly, these results confirmed the generalizability of the machine learning–based workflow across diverse biological models.
Figure 9. Automatic segmentation of retinal ganglion cells (RGCs). The same pipeline generalized to a distinct neuronal cell type with minimal code changes.

3.4. Calcium Flux Analysis in Mouse Primary Cortical Neurons
To extend the applicability of the automated pipeline, calcium flux in mouse primary cortical neurons was analyzed under both normal and Alzheimer’s disease (AD) conditions. The inclusion of multiple fluorescence channels enabled simultaneous monitoring of calcium dynamics and cell survival status following LIS exposure.
Multi-channel fluorescence images were acquired, including Fluo-4 for calcium signals, Ethidium Dimer III (Dead Red) for non-viable cells, and phase contrast views for structural reference. These datasets were processed through the automated workflow, which was adapted with only minor modifications to accommodate multiple input channels.
The workflow proceeded as follows:
- Input Image Selection: Image sets containing calcium, viability, and phase contrast channels were provided for each experiment.
- Dead Cell Detection: A watershed segmentation algorithm was applied to the Dead Red channel to identify and exclude non-viable cells from subsequent calcium flux analysis.
- Live Cell Segmentation: Cellpose was used to automatically delineate individual live neurons, producing accurate masks across all frames in the time-lapse sequences.
- Shockwave Frame Detection and Validation: The peak LIS-induced calcium response was automatically identified from the image series, and fluorescence signals were validated for quality before analysis.
- Quantitative Calcium Analysis: For each valid live neuron, ΔF/F₀ values were calculated to normalize calcium intensity changes. Calcium peaks were detected, and decay kinetics were modeled using a two-phase exponential fit to estimate transient half-lives.
- Data Export and Visualization: Time-course plots were generated (Figure X), showing the onset of LIS-induced responses, calcium peak detection, and subsequent recovery or decline. Results were exported into CSV format for statistical evaluation.
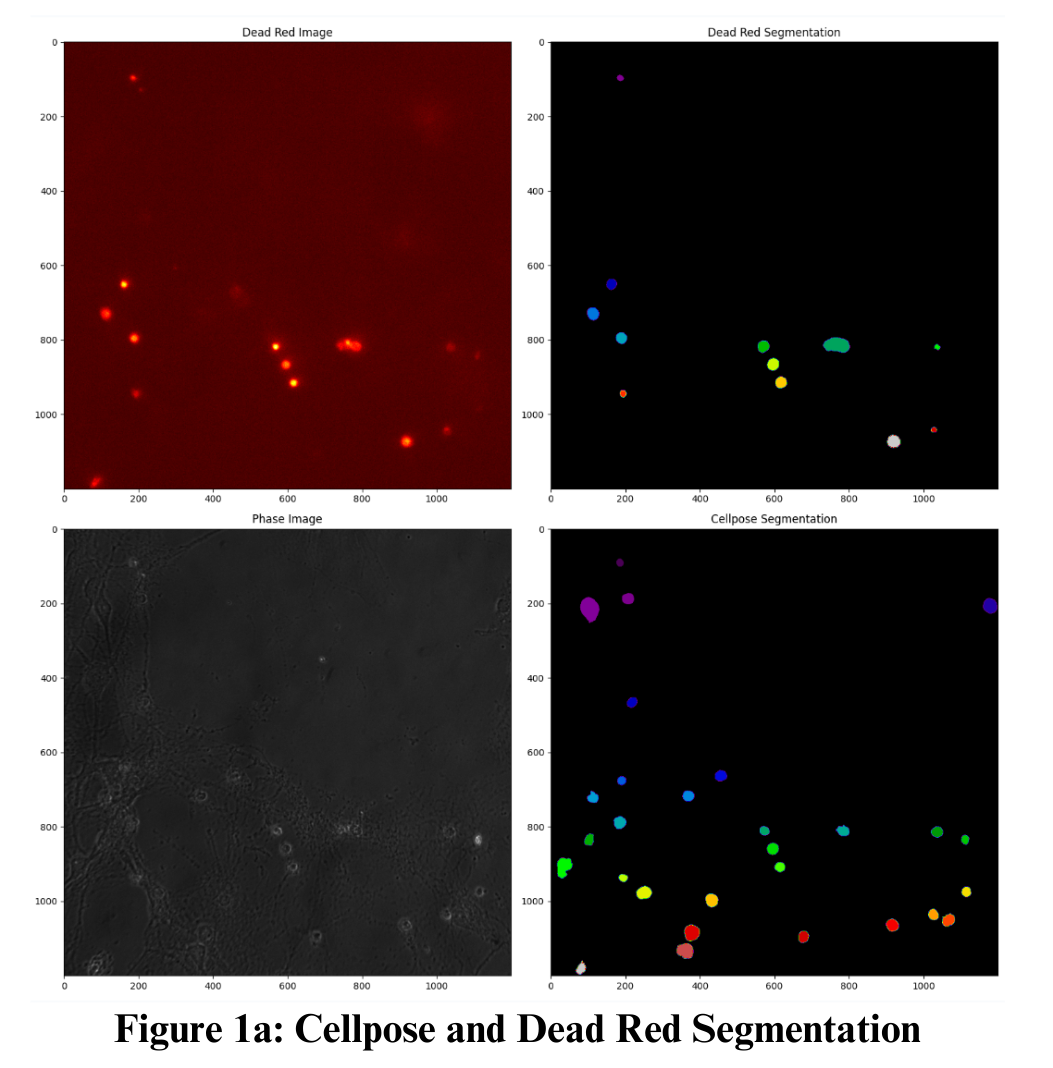
The automated workflow successfully processed multi-channel datasets to segment live and dead neurons and quantify their calcium responses after LIS stimulation. As shown in Figure 13, Cellpose segmentation combined with the Dead Red channel enabled accurate differentiation between viable and non-viable cells, eliminating the need for manual cell-by-cell annotation.
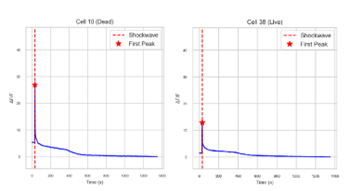
Representative calcium intensity traces for both dead and live neurons were displayed in Figure 14 The pipeline automatically detected fluorescence changes, normalized the signals, and generated time-course plots that tracked calcium responses without requiring manual tracing or frame-by-frame measurement.
These observations demonstrated that the automated image processing pipeline effectively replaced manual methods by providing reproducible segmentation, accurate response quantification, and rapid visualization. The ability to analyze multiple fluorescence channels simultaneously further highlighted the adaptability of the workflow to complex experimental datasets.
Figures must be clear and high quality, preferably in EPS format. Figure axes must be labelled. Any text in the figures must be readable.
4. Conclusions
An automated image processing framework based on machine learning was implemented and validated across several biological applications, including protein recruitment after DNA damage, calcium responses in cortical neurons exposed to laser-induced shockwaves (LIS), retinal ganglion cell (RGC) injury models, and multi-channel calcium imaging in Alzheimer’s disease (AD) neuronal models.
The pipeline integrated cell segmentation, signal detection, quantitative measurement, and data visualization into a unified workflow. In all applications, manual image processing was effectively replaced, reducing analysis time from hours to minutes, eliminating observer bias, and improving reproducibility.
Accurate detection of DNA repair kinetics, automated quantification of calcium flux in neurons and RGCs, and differentiation of live and dead cells in multi-channel datasets demonstrated the adaptability of the workflow. Its performance across different cell types and experimental conditions highlighted both robustness and scalability.
This framework provided an efficient and generalizable solution for large-scale time-lapse fluorescence imaging studies and offered substantial improvement over traditional manual methods. In practical terms, this made the approach easy to adopt in small or mid-sized labs without dedicated informatics support. Everything can run on ordinary hardware, with clear steps, parameters, and checks for reproducibility. The result provided is faster, more consistent analysis that frees time for experiments and interpretation.
References
[1] Meselson, M., & Stahl, F. W. (1958). "The Replication of DNA in Escherichia coli." Proceedings of the National Academy of Sciences, Volume 44(7), 671-682. View Article
[2] Berns, M.W., & Rounds, D.E. (1970). "Cell surgery by laser." Scientific American, 222(2), 98-103. View Article
[3] Berns, M.W., Wright, W.H., & Wiegand Steubing, R. (1991). "Laser microbeam as a tool in cell biology." International Review of Cytology, 129, 1-44. View Article
[4] Botchway, S.W., Reynolds, P., Parker, A.W., & O'Neill, P. (2010). "Use of near infrared femtosecond lasers as sub-micron radiation microbeam for cell DNA damage and repair studies." Mutation Research, 704(1-3), 38-44. View Article
[5] You, Z., Shi, L.Z., Zhu, Q., Wu, P., Zhang, Y.W., Basilio, A., Tonnu, N., Verma, I.M., Berns, M.W., & Hunter, T. (2009). "CtIP links DNA double-strand break sensing to resection." Molecular Cell, 36(6), 954-969. View Article
[6] Wang, H., Shi, L.Z., Wong, C.L., Han, X., Huang, P.Y., Truong, L.N., Zhu, Q., Shao, Z., Chen, D.J., Berns, M.W., Yates, J.R., Chen, L., & Wu, X. (2013). "The Interaction of CtIP and Nbs1 Connects CDK and ATM to Regulate HR-Mediated Double-Strand Break Repair." PLoS Genetics, 9(2), e1003277. View Article
[7] Lu, C., Truong, L.N., Aslanian, A., Shi, L.Z., Li, Y., Hwang, P.Y., Koh, K.H., Hunter, T., Yates, J.R., Berns, M.W., & Wu, X. (2012). "The RING Finger Protein RNF8 Ubiquitinates Nbs1 to Promote DNA Double-strand Break Repair by Homologous Recombination." Journal of Biological Chemistry, 287(52). View Article
[8] He, J., Shi, L.Z., Truong, L.N., Lu, C.S., Razavian, N., Li, Y., Negrete, A., Shiloach, J., Berns, M.W., & Wu, X. (2012). "Rad50 zinc hook is important for the Mre11 complex to bind chromosomal DNA double-stranded breaks." Journal of Biological Chemistry, 287(38), 31747-31756. View Article
[9] Wang, H., Shao, Z., Shi, L.Z., Hwang, P.Y., Truong, L.N., Berns, M.W., Chen, D.J., & Wu, X. (2012). "CtIP Protein Dimerization Is Critical for Its Recruitment to Chromosomal DNA Double-stranded Breaks." Journal of Biological Chemistry, 287(25), 21471-21480. View Article
[10] Truong, L.N., Li, Y., Shi, L.Z., Hwang, P.Y., He, J., Wang, H., Razavian, N., Berns, M.W., & Wu, X. (2013). "Microhomology-mediated End Joining and Homologous Recombination share the initial end resection step." Proceedings of the National Academy of Sciences USA, 110(19), 7720-7725. View Article
[11] Wang, H., Li, Y., Truong, L.N., Shi, L.Z., Hwang, P.Y., He, J., Do, J., Cho, M.J., Li, H., Negrete, A., Shiloach, J., Berns, M.W., Shen, B., Chen, L., & Wu, X. (2014). "CtIP maintains stability at common fragile sites." Molecular Cell, 54(6), 1012-1021. View Article
[12] Voris, H.C. (1950). "Mild head injury (concussion)." American Journal of Surgery, 80(6), 707-713. View Article
[13] Raghupathi, R., McIntosh, T.K., & Smith, D.H. (1995). "Cellular responses to experimental brain injury." Brain Pathology, 5(4), 437-442. View Article
[14] Chen, H., Constantini, S., & Chen, Y. (2015). "A Two-Model Approach to Investigate the Mechanisms Underlying Blast-Induced Traumatic Brain Injury." In: Kobeissy F.H. (Ed.), Brain Neurotrauma: Molecular, Neuropsychological, and Rehabilitation Aspects. CRC Press.
[15] Ell, C., Wondrazek, F., Frank, F., Hochberger, J., Lux, G., & Demling, L. (1986). "Laser-induced shockwave lithotripsy of gallstones." Endoscopy, 18(3), 95-96. View Article
[16] Li, F., Park, T.H., Sankin, G., Gilchrist, C., Liao, D., Chan, C.U., Mao, Z., Hoffman, B.D., & Zhong, P. (2021). "Mechanically induced integrin ligation mediates intracellular calcium signaling with single pulsating cavitation bubbles." Theranostics, 11(12), 6090-6104. View Article
[17] Gomez-Godinez, V., Morar, V., Carmona, C., Gu, Y., Sung, K., Shi, L.Z., Wu, C., Preece, D., & Berns, M.W. (2021). "Laser-Induced Shockwave (LIS) to Study Neuronal Ca²⁺ Responses." Frontiers in Bioengineering and Biotechnology, 9, 598896. View Article
[18] Shah, S.B., Li, Y., Li, S., Hu, Q., Wu, T., Shi, Y., Nguyen, T., Ive, I., Shi, L., Wang, H., & Wu, X. (2024). "53BP1 deficiency leads to hyperrecombination using break-induced replication (BIR)." Nature Communications, 15(1), 8648. View Article
[19] Pachitariu, M., & Stringer, C. (2022). "Cellpose 2.0: how to train your own model." Nature Methods, 19(12), 1634-1641. View Article