Journal of Biomedical Engineering and Biosciences (JBEB)
ISSN: 2564-4998

Volume 9 - Year 2022 - Pages 31-38
DOI: 10.11159/jbeb.2022.006
Estimating Vertical Ground Reaction Force during Running with 3 Inertial Measurement Units
Bouke L. Scheltinga1,2, Hazal Usta1, Jasper Reenalda1,2, Jaap H. Buurke1,2
1University of Twente, Faculty of Electrical Engineering, Mathematics and Computer Science (EEMCS),
Department of Biomedical Signals and Systems
Drienerlolaan 5, Enschede, Overijssel, The Netherlands, 7522 NB
b.l.scheltinga@utwente.nl
2Roessingh Research and Development
Roessinghsbleekweg 33b, Enschede, Overijssel, The Netherlands, 7522 AH
Abstract - Quantification of biomechanical load is crucial to gain insights in the mechanisms causing running related injuries. Ground reaction forces (GRF) can give insights into biomechanical loading, however, measuring GRF is restricted to a gait laboratory. Developments in inertial sensor technology make it possible to measure segment accelerations and orientations outside the lab in the runners’ own environment. The main objective of this study is to estimate vertical GRF with three inertial measurement units using a generic algorithm based on Newtons second law. When using Newton’s second law, it is known that the mass distribution per corresponding acceleration and filtering settings of the acceleration signal do have an influence on the estimated force. Therefore, filtering settings and the mass of the segments were optimized in this study. To apply Newton’s second law to the full body, the accelerations and masses of every segment should be known. However, this requires >10 sensors. By minimizing the number of segments to three, a setup is created that is less obtrusive. Twelve rear foot strike (RFS) runners performed nine trials at three different velocities (10, 12 and 14km/h) and three different stride frequencies (low, preferred, high), on a instrumented treadmill. Inertial measurement units were placed at sternum, pelvis, upper legs, tibias and feet. An optimization was performed to find the optimal sensor configuration. The root mean squared error (RMSE) between the estimated GRF and measured GRF was used as loss function in the optimization. As performance measure of the algorithm, RMSE, active peak error and Pearson’s correlation coefficient were used. The setup with sensors on the tibia and pelvis showed the best result, with an average RMSE of 0.179 bodyweight, peak error of 3.6% and Pearson’s correlation coefficient of 0.98. Using leave-one-subject-out cross validation, it is shown that the algorithm is generalizable within the population of RFS runners. Model performance decreases with velocity but increases with stride frequency. The main error of the algorithm is seen in the first 25% of the stance phase, however, the general performance is comparable or better than what is described in current literature.
Keywords: Ground reaction force, running, inertial measurement units
© Copyright 2022 Authors This is an Open Access article published under the Creative Commons Attribution License terms. Unrestricted use, distribution, and reproduction in any medium are permitted, provided the original work is properly cited.
Date Received: 2022-10-12
Date Accepted: 2022-10-23
Date Published: 2022-11-16
1. Introduction
Worldwide, running is a very popular sport. Unfortunately, a lot of runners are plagued by injuries [1]. Monitoring biomechanical load and especially changes in biomechanical load can help in understanding the development of running related injuries [2]. Ground reaction force (GRF) is seen as an important measure to quantify biomechanical load during running [3]. Furthermore, inverse dynamics can be applied to estimate structure specific load if GRFs are linked with kinematics. However, the measurement of GRF is restricted to the laboratory setting as a force plate or an instrumented treadmill is needed to measure the forces. A sensor set-up with a minimal amount of sensors to quantify GRF as a measure of biomechanical load would be of great help in (longitudinal) studies to get a better understanding in the development of running injuries [2], [4] and monitoring training loads.
Inertial measurement units (IMUs) can be used to estimate GRFs, for example, it is shown that there is a relation between peak tibial acceleration and the peak vertical ground reaction force [5]. More recently, a Kalman based method was used to estimate the GRF during the whole stance phase, however there was still an error in the estimated peak value (6.1-7.1%) and relatively high error in the loading rate (>24%) [6]. Furthermore, it is shown that an artificial neural network is capable in estimating vertical GRFs from IMU data [7]. However, it appears to be difficult to create general models, applicable to a large group of subjects when using machine learning methods [7]. Furthermore, it appears to be hard to estimate the absolute values of the GRF [8]. For methods based on a physical model, it is shown that IMU filter settings (cut-off frequency and order) do influence the GRF estimations [9]. Besides filtering, the mass distribution over the various body segments plays a role in the performance of the GRF estimation algorithm [10]. To apply Newton’s second law to the full body, the acceleration per segment and corresponding mass should be known, leading to a model with >10 segments. Such a setup is obtrusive for the runner. As we know that the body centre of mass is located in the trunk, accelerations of the trunk multiplied with its mass would mostly give a rough estimation of the GRF. In RFS running, the GRF profile has an impact and an active peak [11]. The legs are absorbing most of the impact shortly after ground contact. Therefore it was reasoned that a configuration with a sensor on the trunk and on each leg would be capable to estimate vertical GRF in running. The optimal filter settings and mass distribution for the three segments can be obtained with an optimization, such that the difference between estimated GRF (eGRF) and measured GRF (mGRF) is minimal.
An algorithm intended to be used in the runners’ environment should be robust to variations in different parameters. It is already shown that accuracy can be dependent on running speed [10], but the algorithm should also work at a range of stride frequencies. Hence, the effect of running velocity and stride frequency on the performance of the algorithm is quantified.
The primary objective of this work is to estimate vertical GRF with three IMUs using a generic model based on Newtons second law. The secondary objective is to validate the model for different velocities and stride frequencies. Since filter frequencies, filter orders and mass distribution play a role in the performance of the GRF estimation, these parameters will be optimized in this study.
2. Material and Methods
2. 1. Experimental Design and Measurement Setup
Twelve healthy experienced heel strike runners participated in this study (4F, 8M; age 31.6y ± 9.0y, height 1.80m ± 0.11m, mass 74.3kg ± 17.5kg). All participants signed a written informed consent and the protocol was approved by the medical ethical committee (CCMO Arnhem-Nijmegen).
Participants were equipped with inertial sensors following the lower body configurations of the Xsens MVN Link system, (Xsens Technologies, Enschede, The Netherlands) with a sampling frequency of 240Hz, using double sided tape. Sensors were placed on the sternum, pelvis, both feet, both tibias (proximal) and both upper legs. On top of the sensor, additional tape was placed and leg sleeves were pulled over the tibia sensors to prevent movement artefacts. After sensor placement, a sensor to segment calibration was performed according to the manufacturer’s instructions.
GRF data was collected using a 3-dimensional force plate instrumented dual-belt treadmill (Y-mill, Motek Medical, Amsterdam, The Netherlands) at a sampling frequency of 2048Hz.
First, the subject mass was determined during a static trial on the force plate. Then, the participants ran at three different speeds in random order (10, 12 and 14km/h) and three different stride frequencies, relative to their preferred stride frequency (100, 110 and 90%) for 90 seconds. For each speed, the preferred stride frequency was determined during the first trial. In the other two trials, the stride frequency was imposed using a metronome. Each trial started with three jumps for synchronization of the IMUs and treadmill. There was a 3-minute break between the trials to prevent the participants from fatiguing.
2. 2. Data Processing
mGRF data was filtered using a sixth-order, zero-phase shift low pass Butterworth filter with a cut-off frequency (Fc) of 30Hz. Next, this data was resampled to 240Hz to match the IMU system. Then, the GRF data was normalized for body weight. From the IMUs, the sensor free acceleration is used. This is the gravity subtracted acceleration in the global frame. Next, the cross correlation between the sensor free acceleration of the tibia in vertical direction with the vertical mGRF was calculated. The lag value corresponding to the maximum in the correlation was used to synchronize the treadmill and IMUs.
40 strides were extracted from the middle part of each trial and used for the fitting and evaluation of the (eGRF). Data was labelled as flight-phase if the mGRF was <25N for longer than 0.05s and as stance-phase if the measured GRF was >25N for longer than 0.05s.
2. 3. GRF Estimation Model
Six different sensor configurations were created, combining two sensors on the leg (tibias, thighs or feet) and one on the trunk (pelvis or sternum). To obtain eGRF from acceleration using three sensors, Newton’s second law is used as shown in Eq. 1.

mb Represents the body mass of the subject, g the gravitational acceleration, i the sensor number, WF the weight factor and az the sensor free acceleration in vertical direction. The eGRF was normalized for body weight (BW).
WF should correspond to the fraction of body mass corresponding to the segment where the sensor is attached. Since we have two symmetrically placed sensors on the legs, we assume the corresponding weight factors to be equal. Also, the sum of all weight factors should equal one to ensure the full body mass being used. Hence, only one parameter for WF had to be optimized in the case of three sensors.
Besides the weight factor, it is shown that IMU filter properties influence eGRF [9]. Therefore, the IMU filter cut-off frequencies and orders of the used sensors are included in the optimization. Again, due to assuming symmetry, the filter settings for the leg sensors were assumed to be equal.
2. 4. Model Optimization
An optimization was performed where one weight factor WF, two filter orders and two cut-off frequencies were optimized. This optimization is performed using the Optuna optimization framework [12]. The loss function is defined as the root mean squared error (RMSE) between the eGRF and mGRF during stance-phase. This value was minimized using an optimization with 1000 trials. The optimization was initiated 5 times and the best results were used. The weight factor was optimized between 0 and 1, cut-off frequencies between 0.5 and 50Hz and the orders between 2 and 8 with increments of 2.
2. 4. Model Evaluation
The main performance metric is RMSE between mGRF and eGRF during stance phase. This metric is indicative for the accuracy over the full stance phase. Further, Pearson’s correlation coefficient is calculated between mGRF and eGRF. Also, the absolute (active) peak error is calculated in bodyweights and as a relative value. To evaluate the generalizability of the models, leave-one-subject-out-cross-validation was performed for the best sensor configuration. The same principle was used to investigate the generalizability to velocity and stride frequency. Each time, one velocity or stride frequency was left out while the parameters were optimized for the other velocities or stride frequencies. Filter orders were fixed for this purpose based on the best results with the full data set.
Lastly, a sensitivity analyses on the optimized parameters is performed to inspect the sensitivity to changes in the cut-off frequencies and the weight factor. All combinations of cut-off frequencies between 4-20Hz (sensor on legs) and 4-12Hz (sensor trunk) were analysed, and the performance metrics were shown in a heatmap. For the weight factor, the values between 0.3 and 0.8 were analysed.
All data processing and optimizations were done in Python 3.8.
3. Results
With a RMSE of 0.179 body weight (BW), the pelvis-tibias configuration had the best performance (Table 1). This configuration also shows the lowest peak error (3.60%) and a very strong correlation between the eGRF and mGRF (r=0.98). From the WF, it can be concluded that the sensor on the trunk has a higher contribution to the estimate than the sensors on the lower body. For the configurations involving the feet, it is seen that there is hardly any contribution from the feet sensors (WF=0.97 and 0.96).
The leave-one-subject-out cross validation shows variation in the performance per subject, a RMSE between 0.128 and 0.236BW is achieved (Table 2). For all subjects, there is a very strong correlation between eGRF and mGRF. The model parameters are relatively stable, with WF between 0.51 and 0.58, Fc pelvis between 5.6 and 6.6Hz and Fc tibias between 8.2 and 8.8Hz.
Model performance decreases with increasing speed, however, still a RMSE of 0.21BW is achieved at 14km/h (Table 3, Fig. 1). Also, the model parameters remain relatively constant. Performance of the model is best at high and preferred stride frequency (Table 4). At a lower stride frequency, the impact peak (at ~15% stance) is more prominent and also the active peak (mid-stance) is slightly higher in the mGRF (Fig. 2). The largest deviation between eGRF and mGRF is in the first 25% of the stance phase.
The sensitivity analyses shows that there is a surface between 7-10Hz for the tibias and 5.5-7.5Hz for the pelvis with a low RMSE, relative mean peak error and high Pearson’s correlation coefficient (Fig. 3). It is seen that the optimization curves for the different outcome measures differ. A weight factor for the pelvis between 0.45 and 0.65 gives a RMSE <0.19BW, a relative mean peak error <4.6% and a Pearson’s correlation coefficient >0.97 (Table 5).
Table 1. Effect of sensor configuration on estimated ground reaction force and model parameters
|
Sensor configuration |
RMSE (BW) |
Absolute mean peak error (BW) |
Relative mean peak error (%) |
Pearson’s r |
WF pelvis / sternum |
Fc pelvis / sternum |
Fc tibias / thighs / feet |
Order pelvis / sternum |
Order tibias / thighs / feet |
|
Pelvis + tibias |
0,179 |
0,086 |
3,60 |
0,98 |
0,55 |
6,0 |
8,7 |
4 |
2 |
|
Sternum + tibias |
0,180 |
0,132 |
5,55 |
0,97 |
0,59 |
6,4 |
7,8 |
4 |
2 |
|
Pelvis + thighs |
0,208 |
0,093 |
3,90 |
0,97 |
0,63 |
4,2 |
6,7 |
4 |
4 |
|
Sternum + thighs |
0,192 |
0,084 |
3,50 |
0,97 |
0,45 |
6,6 |
4,7 |
8 |
2 |
|
Pelvis + feet |
0,236 |
0,113 |
4,72 |
0,96 |
0,97 |
4,4 |
34,8 |
6 |
8 |
|
Sternum + feet |
0,221 |
0,120 |
5,06 |
0,96 |
0,96 |
5,3 |
34,2 |
4 |
6 |
Table 2. Leave-one-subject-out-cross-validation using the pelvis-tibias configuration. Orders were fixed at 4 (pelvis) and 2 (tibias)
|
Subject |
RMSE (BW) |
Absolute mean peak error (BW) |
Relative mean peak error (%) |
Pearson’s r |
WF pelvis |
Fc pelvis (Hz) |
Fc tibia (Hz) |
|
01 |
0,192 |
0,065 |
2,37 |
0,98 |
0,53 |
6,1 |
8,5 |
|
02 |
0,128 |
0,048 |
2,10 |
0,99 |
0,56 |
5,9 |
8,8 |
|
03 |
0,162 |
0,074 |
2,94 |
0,99 |
0,55 |
5,8 |
8,7 |
|
04 |
0,170 |
0,050 |
2,09 |
0,98 |
0,53 |
6,1 |
8,7 |
|
05 |
0,167 |
0,055 |
2,35 |
0,98 |
0,55 |
6,0 |
8,6 |
|
06 |
0,228 |
0,192 |
7,45 |
0,97 |
0,58 |
5,6 |
8,9 |
|
07 |
0,135 |
0,100 |
4,18 |
0,99 |
0,55 |
6,0 |
8,8 |
|
08 |
0,194 |
0,056 |
2,29 |
0,98 |
0,53 |
6,2 |
8,6 |
|
09 |
0,236 |
0,050 |
2,06 |
0,95 |
0,52 |
6,3 |
8,5 |
|
10 |
0,165 |
0,099 |
4,74 |
0,97 |
0,51 |
6,6 |
8,2 |
|
11 |
0,207 |
0,114 |
5,33 |
0,96 |
0,56 |
6,1 |
8,7 |
|
12 |
0,169 |
0,164 |
7,30 |
0,98 |
0,55 |
6,1 |
8,8 |
|
Mean |
0,179 |
0,089 |
3,77 |
0,98 |
0,54 |
6,1 |
8,7 |
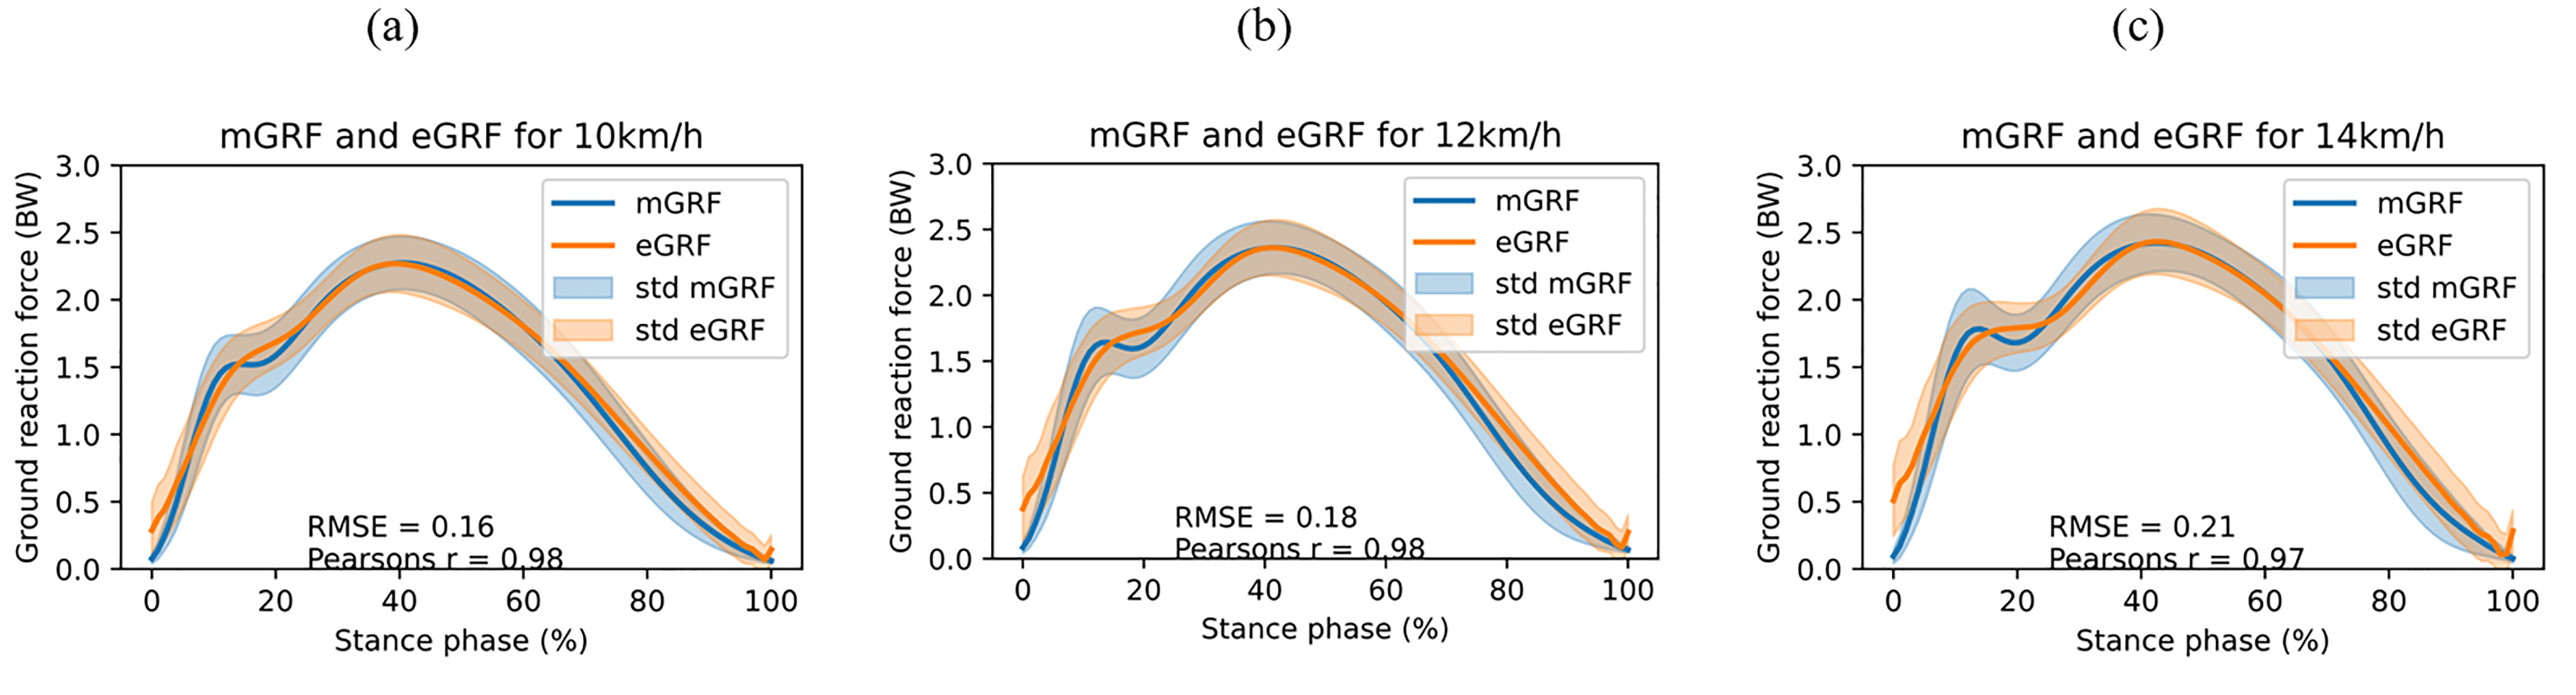
Table 3. Performance per velocity using the pelvis-tibias configuration. Filter orders were fixed at 4 (pelvis) and 2 (tibias)
|
Speed (km/h) |
RMSE (BW) |
Absolute mean peak error (BW) |
Relative mean peak error (%) |
Pearson’s r |
WF pelvis |
Fc pelvis (Hz) |
Fc tibias (Hz) |
|
10 |
0,157 |
0,085 |
3,68 |
0,98 |
0,55 |
6,1 |
8,6 |
|
12 |
0,176 |
0,083 |
3,46 |
0,98 |
0,54 |
6,1 |
8,6 |
|
14 |
0,205 |
0,092 |
3,74 |
0,97 |
0,54 |
6,1 |
8,7 |
Table 4. Performance per stride frequency using the pelvis-tibias configuration. Orders were fixed at 4 (pelvis) and 2 (tibias)
|
Relative stride frequency |
RMSE (BW) |
Absolute mean peak error (BW) |
Relative mean peak error (%) |
Pearson’s r |
WF pelvis |
Fc pelvis (Hz) |
Fc tibias (Hz) |
|
Low (90%) |
0,189 |
0,090 |
3,68 |
0,98 |
0,53 |
6,1 |
8,7 |
|
Preferred (100%) |
0,174 |
0,082 |
3,42 |
0,98 |
0,54 |
6,2 |
9,3 |
|
High (110%) |
0,175 |
0,091 |
3,96 |
0,98 |
0,59 |
5,8 |
9,3 |
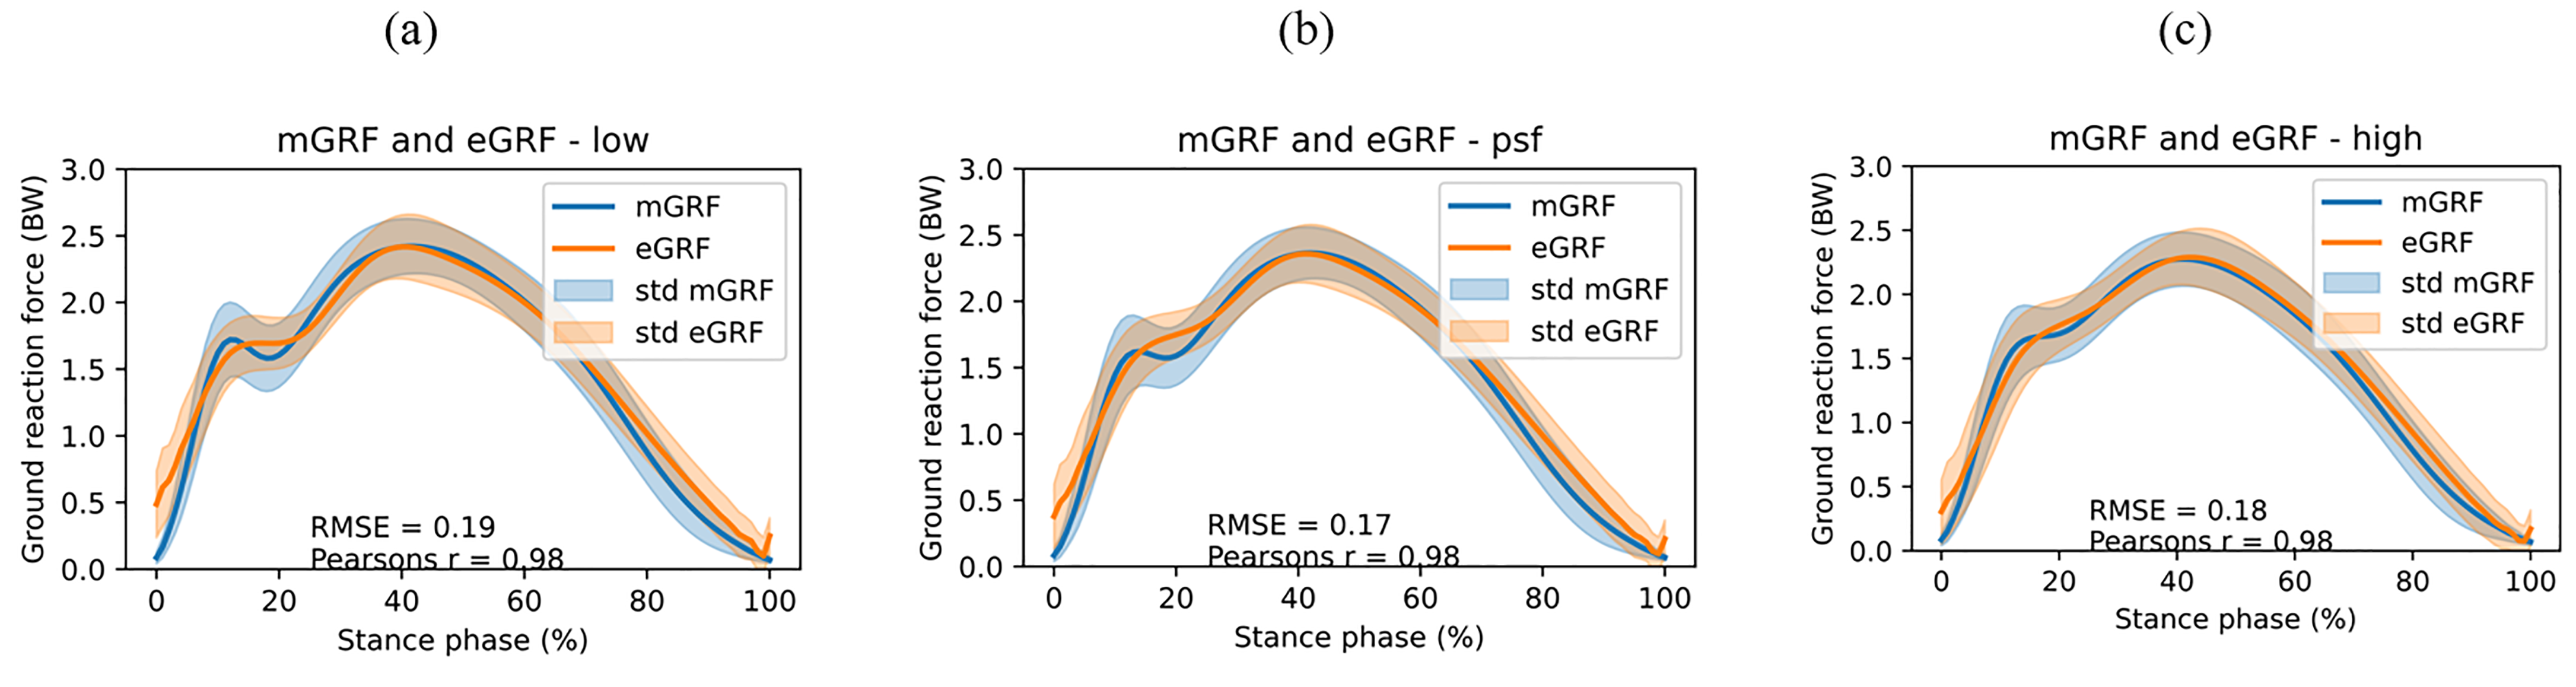
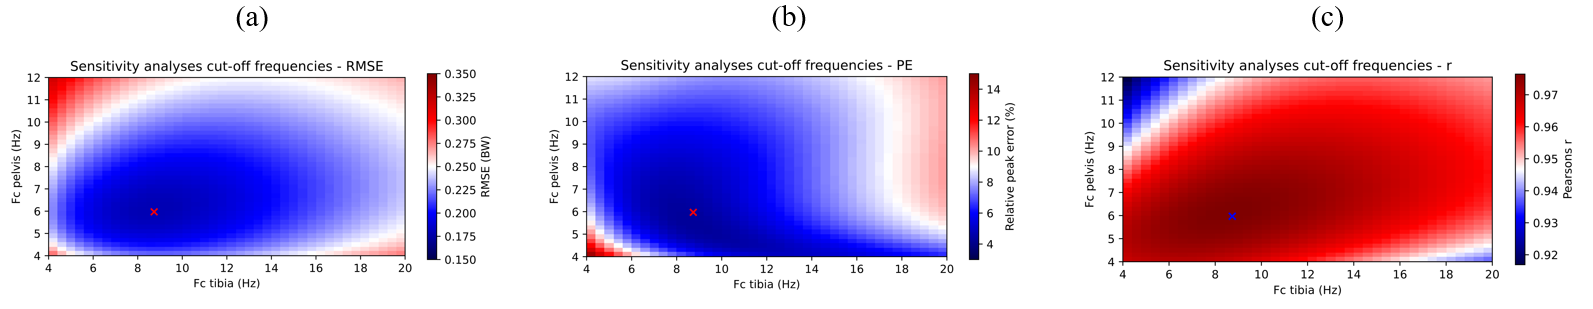
Table 5. Sensitivity analyses with the weight factor. Cut-off frequencies were fixed at the optimum values for the whole data set (6.0Hz for pelvis and 8.7Hz for tibia). The optimum was found at 0.54
|
Weight factor pelvis |
0,30 |
0,35 |
0,40 |
0,45 |
0,50 |
0,55 |
0,60 |
0,65 |
0,70 |
0,75 |
0,80 |
|
RMSE (BW) |
0,223 |
0,209 |
0,196 |
0,187 |
0,181 |
0,179 |
0,181 |
0,186 |
0,195 |
0,207 |
0,222 |
|
Relative mean peak error (%) |
5,36 |
5,06 |
4,81 |
4,60 |
4,46 |
4,40 |
4,41 |
4,50 |
4,67 |
4,94 |
5,32 |
|
Pearson’s r |
0,960 |
0,966 |
0,970 |
0,974 |
0,976 |
0,976 |
0,976 |
0,975 |
0,972 |
0,969 |
0,964 |
4. Discussion
The purpose of this study was estimate vertical GRF with three IMUs using a Newton based approach. Using the pelvis-tibias configuration, a lower RMSE (<0.236BW, 0.179BW averaged over all data) compared to other work (0.27BW [7] and 0.28BW [13]) is achieved. The model shows a very strong correlation (Pearson’s r=0.98) with the measured GRF, comparable to other work (r=0.90-0.99 [7]). It is seen that accuracy decreases with speed but increases with stride frequency, indicating that as forces become larger, the estimation becomes less accurate. Note that RMSE is an absolute measure for error. However, if we look at the relative peak error and Pearson’s correlation coefficient, also a decrease in accuracy is seen towards 14km/h.
As seen from the weight factor, the major contribution for the GRF estimation came from the sensor on the trunk (except for the sternum-thighs configuration). This is explained by the fact that the sensor on the trunk is closer to the centre of mass of the body. With the sternum-feet and pelvis feet configuration, there was hardly any contribution from the feet sensors (WF=0.96 and WF=0.97), but there was still a RMSE of 0.224BW. It is expected that a configuration with only one sternum sensor will have very similar results. Future research could investigate the accuracy of GRF estimation with only one IMU.
From the leave-one-subject-out cross validation differences in performance per subject are seen. So is the lowest RMSE of 0.128BW found for S02, the largest value found for S09 and is the RMSE 0.179BW on average. If the algorithm is used on newly measured heel strike runners, it is expected that the RMSE falls within that range. The plots in Fig. 2 indicate that most of the error is seen in the first 25% of the stance phase (impact peak). Although peak GRF is a measure of interest [14], also loading rate or impact peak are used [15], where the latter two are extracted from the first 25% of the stance phase. This is a limitation of this algorithm. A solution could be to redefine the loss function to prioritize the first 25% of the stance phase in the optimization. However, this will go with a decrease in performance over the complete stance phase. The parameters of the optimizations in the leave-one-subject-out cross validations are within a small range, it can be assumed that adding more subjects would not have much impact on the optimum parameters of the algorithm. The sensitivity analyses also indicates that, if the optimized values are changed (for example because more subjects are added) it will not have much influence on the performance on the group level.
Usually, IMU signals are filtered with an integer frequency as cut-off frequency (e.g. 100, 60 and 50Hz are commonly seen) [16]. Though, to get the optimal set of parameters of the model, it was chosen to optimize at a higher significance. However, if the found cut-off frequencies are rounded to the next integer, probably similar performance is obtained as shown by the sensitivity analyses (Fig 3.).
Although the majority of runners has a heel strike [17], the model should be validated for other foot strike patterns as well to be applicable to non-heel strikers. It is known that GRF profile is dependent on the foot strike pattern, thus it might be the case that a different cut-off frequencies or weight factors are needed, resulting in different model parameters. Furthermore, the subjects included in this study were all experienced runners (>15km of running per week for 6 months). The algorithm should be validated on non-experienced runners as well.
The current research was performed on a treadmill, however it is not limited to a lab setting. Before applying this method in practice, the implications of outdoor effects should be investigated. For example, the effects of running surface and incline running should be investigated. Testing the model for running surface is very challenging, as it is hard to validate the estimations. However, first an outdoors validation where the model is tested outside the lab (e.g with a mobile force plate on instrumented track) is possible. Alternatively, a measurement protocol where both an indoors and outdoors setting are tested consecutively could be used. Besides the ability to bring the technology outside, it is important that the setup has a high test-retest repeatability. There are several factors that can influence this repeatability. It is shown that location of the IMU on the tibia matters, [18] furthermore the attachment method of the IMU influences the measured values [16]. As the accuracy of the algorithm is highly dependent on the measured acceleration, it is important that the same location and attachment methods as this study are used when applying the algorithm.
A future direction to improve the estimate of vertical GRF can be by combining a physical model with a machine learning model in a so-called hybrid model [19].
4. Conclusion
The main goal of this study was to estimate vertical ground reaction force using three IMUs, robust for different speeds, stride frequencies and subjects. This study shows that it is possible to estimate vertical GRF outside the lab for heel strike runners at different velocities and stride frequencies with only 3 IMUs. This could help in the future to quantify biomechanical load in the runners’ own environment.
References
[1] R. N. Van Gent, D. Siem, M. Van Middelkoop, A. G. Van Os, S. M. A. Bierma-Zeinstra, and B. W. Koes, "Incidence and determinants of lower extremity running injuries in long distance runners: A systematic review," British Journal of Sports Medicine, vol. 41, no. 8, pp. 469-480, 2007, doi: 10.1136/bjsm.2006.033548. View Article
[2] M. L. Bertelsen, A. Hulme, J. Petersen, R. K. Brund, H. Sørensen, C. F. Finch, E. T. Parner, and R. O. Nielsen, "A framework for the etiology of running-related injuries," Scandinavian Journal of Medicine & Science in Sports, vol. 27, no. 11, pp. 1170-1180, Nov. 2017, doi: 10.1111/sms.12883. View Article
[3] J. Verheul, N. J. Nedergaard, J. Vanrenterghem, and M. A. Robinson, "Measuring biomechanical loads in team sports-from lab to field," Science and Medicine in Football, vol. 4, no. 3, pp. 246-252, 2020, doi: 10.1080/24733938.2019.1709654. View Article
[4] S. S. Yeung, E. W. Yeung, and L. D. Gillespie, "Interventions for preventing lower limb soft-tissue running injuries," Cochrane Database of Systematic Reviews, no. 7, 2011, doi: 10.1002/14651858.cd001256.pub2. View Article
[5] E. Charry, W. Hu, M. Umer, A. Ronchi, and S. Taylor, "Study on estimation of peak Ground Reaction Forces using tibial accelerations in running," in Proceedings of the 2013 IEEE 8th International Conference on Intelligent Sensors, Sensor Networks and Information Processing: Sensing the Future, ISSNIP 2013, 2013, vol. 1, pp. 288-293. doi: 10.1109/ISSNIP.2013.6529804. View Article
[6] B. LeBlanc, E. M. Hernandez, R. S. McGinnis, and R. D. Gurchiek, "Continuous estimation of ground reaction force during long distance running within a fatigue monitoring framework: A Kalman filter-based model-data fusion approach," Journal of Biomechanics, vol. 115, p. 110130, Nov. 2021, doi: 10.1016/j.jbiomech.2020.110130. View Article
[7] F. J. Wouda, M. Giuberti, G. Bellusci, E. Maartens, J. Reenalda, B.-J. F. van Beijnum, and P. H. Veltink, "Estimation of Vertical Ground Reaction Forces and Sagittal Knee Kinematics During Running Using Three Inertial Sensors," Frontiers in Physiology, vol. 9, pp. 1-14, Mar. 2018, doi: 10.3389/fphys.2018.00218. View Article
[8] A. Ancillao, S. Tedesco, J. Barton, and B. O'flynn, "Indirect measurement of ground reaction forces and moments by means of wearable inertial sensors: A systematic review," Sensors (Switzerland), vol. 18, no. 8. 2018. doi: 10.3390/s18082564. View Article
[9] E. M. Day, R. S. Alcantara, M. A. McGeehan, A. M. Grabowski, and M. E. Hahn, "Low-pass filter cutoff frequency affects sacral-mounted inertial measurement unit estimations of peak vertical ground reaction force and contact time during treadmill running," Journal of Biomechanics, vol. 119, Apr. 2021, doi: 10.1016/J.JBIOMECH.2021.110323. View Article
[10] D. S. Komaris, E. Perez-Valero, L. Jordan, J. Barton, L. Hennessy, B. O'Flynn, and S. Tedesco, "Effects of segment masses and cut-off frequencies on the estimation of vertical ground reaction forces in running," Journal of Biomechanics, vol. 99, p. 109552, Jan. 2020, doi: 10.1016/J.JBIOMECH.2019.109552. View Article
[11] A. H. Gruber, B. R. Umberger, R. H. Miller, and J. Hamill, "Muscle mechanics and energy expenditure of the triceps surae during rearfoot and forefoot running," bioRxiv, p. 424853, Sep. 2018, doi: 10.1101/424853. View Article
[12] T. Akiba, S. Sano, T. Yanase, T. Ohta, and M. Koyama, "Optuna: A Next-generation Hyperparameter Optimization Framework," Proceedings of the ACM SIGKDD International Conference on Knowledge Discovery and Data Mining, pp. 2623-2631, Jul. 2019, doi: 10.1145/3292500.3330701. View Article
[13] Y. Ohtaki, K. Sagawa, and H. Inooka, "A Method for Gait Analysis in a Daily Living Environment by Body-Mounted Instruments," JSME International Journal Series C, vol. 44, no. 4, pp. 1125-1132, 2001, doi: 10.1299/jsmec.44.1125. View Article
[14] D. Kiernan, D. A. Hawkins, M. A. C. Manoukian, M. McKallip, L. Oelsner, C. F. Caskey, and C. L. Coolbaugh, "Accelerometer-based prediction of running injury in National Collegiate Athletic Association track athletes," Journal of Biomechanics, vol. 73, pp. 201-209, 2018, doi: 10.1016/j.jbiomech.2018.04.001. View Article
[15] C. D. Johnson, A. S. Tenforde, J. Outerleys, J. Reilly, and I. S. Davis, "Impact-Related Ground Reaction Forces Are More Strongly Associated With Some Running Injuries Than Others," American Journal of Sports Medicine, vol. 48, no. 12, pp. 3072-3080, Oct. 2020, doi: 10.1177/0363546520950731. View Article
[16] K. R. Sheerin, D. Reid, and T. F. Besier, "The measurement of tibial acceleration in runners-A review of the factors that can affect tibial acceleration during running and evidence-based guidelines for its use," Gait and Posture, vol. 67. 2019. doi: 10.1016/j.gaitpost.2018.09.017. View Article
[17] P. Larson, E. Higgins, J. Kaminski, T. Decker, J. Preble, D. Lyons, K. McIntyre, and A. Normile, "Foot strike patterns of recreational and sub-elite runners in a long-distance road race," https://doi.org/10.1080/02640414.2011.610347, vol. 29, no. 15, pp. 1665-1673, 2011, doi: 10.1080/02640414.2011.610347. View Article
[18] A. G. Lucas-Cuevas, A. Encarnación-Martínez, A. Camacho-García, S. Llana-Belloch, and P. Pérez-Soriano, "The location of the tibial accelerometer does influence impact acceleration parameters during running," https://doi.org/10.1080/02640414.2016.1235792, vol. 35, no. 17, pp. 1734-1738, Sep. 2016, doi: 10.1080/02640414.2016.1235792. View Article
[19] R. D. Gurchiek, N. Cheney, and R. S. McGinnis, "Estimating biomechanical time-series with wearable sensors: A systematic review of machine learning techniques," Sensors (Switzerland), vol. 19, no. 23, 2019, doi: 10.3390/s19235227. View Article