Journal of Biomedical Engineering and Biosciences (JBEB)
ISSN: 2564-4998

Volume 9 - Year 2022 - Pages 21-30
DOI: 10.11159/jbeb.2022.005
Agent-Based Simulation for Localized COVID-19 Intervention Decision
Jason Starr1, Morgan Kain2
1Briarcliff High School, 81 Cedar Drive East, Briarcliff Manor, United States, jasonmmstarr@gmail.com
2Pennsylvania State University, United States, morganpkain@gmail.com
Abstract - Disease models have been a helpful resource which have guided health organizations in choosing appropriate interventions during the COVID-19 pandemic. However, most current models simulate disease spread on a countrywide/statewide level, lacking specificity for localities such as towns or counties. As a result, one-size-fits-all policies are being instituted for entire states despite localities being heterogeneous in many important factors (population density, age demographics, and vaccination rate). Models tailored to individual localities are necessary to facilitate local level health action. In this research, a novel agent-based disease model was created using NetLogo to simulate localized COVID-19 disease dynamics. Individual agents represent each member of a population, and their individual traits (vaccination status, age, etc.) conform to the model input (vaccination rate, age distribution, etc.). Interactions between these agents produce the model outputs, which include predicted infections and deaths. The model was validated using data from state and local health agencies for Westchester County, NY (84.2% accuracy). Using the model, this research aims to answer the following question: what local factors affect COVID-19 outbreak severity and intervention impact? To accomplish this, a sensitivity analysis was conducted for three local variables (vaccination rate, age distribution, intervention applied) and a comparison of locality simulation was conducted for four different U.S. counties. From the results attained, this research concluded that vaccination rate, age distribution, and intervention applied in a locality all contribute significantly to risk level differences between localities, and that higher risk localities are impacted harder by interventions than those with lower risk. Localities can use this model to make health related decisions, and a website (www.localcovidmodel.org) has been created for model access.
Keywords: Agent-Based Modeling, COVID-19 Prediction, Localized Intervention, Contextualized Modeling, NetLogo
© Copyright 2022 Authors This is an Open Access article published under the Creative Commons Attribution License terms. Unrestricted use, distribution, and reproduction in any medium are permitted, provided the original work is properly cited.
Date Received: 2022-09-16
Date Accepted: 2022-09-26
Date Published: 2022-10-11
1. Introduction
1.1. COVID-19 and Public Health
COVID-19, caused by the emerging virus SARS-CoV-2, has caused a dangerous pandemic that infected hundreds of millions globally [1]. Non-pharmaceutical interventions have been some of the most important and effective strategies in use during the pandemic; it is shown that countries which act early to institute these interventions see far fewer cases and deaths than those who do not [5]. However, many interventions were prematurely lifted because of uninformed decision making [7], resulting in pandemic resurgences despite efforts to stop its spread.
Disease modeling can be used to predict the future outcome of a disease outbreak [3][6]. These predictions can be helpful for organizations such as the CDC to create health guidelines and interventions to control the pandemic.
1.2. Current Modeling Applications
Currently, much disease modelling for COVID-19 is done on the nation-wide and state-wide level [1]. Though these forecasts are helpful for national and state guidelines, the data produced by these models are not tailored specifically to cities, towns, school districts, or counties, often forcing such localities to follow one-size-fits-all guidelines from the state.
The age and vaccination status of an individual plays a major role in their susceptibility and transmissibility [2][16]. Thus, the age distribution and vaccination rate of a population will influence the risk-level of a community to COVID-19. As a result, each community will vary in their needs for protection.
1.3. Compartmental Disease Modelling
Compartmental disease models use differential equations to describe the movement of people between compartments (e.g., susceptible or infected). Because of this, most compartmental models do not recognize each person as an individual, and instead assumes a homogeneous population where all members transmit disease equally [9][11]. This may lead to inaccuracy, as disease spread is inherently heterogeneous, meaning that some will be more infectious than others [7]. These differences in spread may result from differences social interaction rates [4]. Since heterogeneity is more prevalent in small populations, it is difficult to capture certain local differences with standard compartmental models.
1.4. Agent-Based Disease Modeling
An agent-based model is a type of disease model that represents each individual person in real life as an agent. Agents are guided by simple and programmable instructions and can interact with each other by movement and contact or by forming a social network [18]. Agents are often assigned unique parameters such as age [18]. Unlike compartmental models, the individuality of agents represented by this type of model makes it ideal for simulating disease heterogeneity and small-scale social interactions (Gomez et al., 2020). Agent-based models are the preferable model for the purposes of this research.
NetLogo is a programming language and IDE specifically used to develop agent-based models. Several previous studies have been done on disease models developed using NetLogo, including a simulation of COVID-19 spread in Piedmont, Italy [10], a simulation of COVID-19 spread in refugee camps [9], and a simulation of COVID-19 based on the effects of different sized social gatherings [8]. Although the above models created using NetLogo have explored localized simulation, the models are programmed on an ad hoc basis, only simulating the original locality it was created in. A localized disease model that tailors its results to different localities given user input is needed in order to function as a decision-making tool for local administrations.
1.5. Research Goals
A novel agent-based disease model was developed using NetLogo to simulate how COVID-19 spreads in a locality. This model simulates three different interventions: mask mandate, testing and isolating, and lockdown. By using the population size, population density, vaccination rate, and age demographics of the locality as an input, the model can produce different results for each locality that are tailored to its population and predict which interventions are most appropriate or effective for that region. Using the model, this research will answer the following question: what local factors affect COVID-19 outbreak severity and how does the impact of interventions differ from locality to locality?
2. Methods
2.1. Model Development
This model was built using the agent-based modelling software NetLogo [17], which consists of mobile agents (representing humans in this model) that move and interact on a gridded canvas separated into square patches.
The user of this model can specify the population size, area, initial infected agents, vaccination rate, age demographics (ratio of young to adults to elderly), variant (Alpha, Delta, Omicron), intervention used (mask mandate, testing and isolation, lockdown), and compliance rate to such interventions. As the simulation starts, agents are randomly selected to be young (age 0-20), adult (age 21-59), elderly (age 60+), vaccinated, or unvaccinated based on the specified age demographics and vaccination rate (assuming same chance of vaccination in each age group) and are randomly chosen to show compliance based on the compliance rate.
During a simulation, the agents move in the direction they are facing and turn a random amount between zero and fifty degrees each day and will interact with other agents that are on its patch, having a chance to infect other agents or become infected. The simulation ends when no more agents are infected. The simulation records the cases over time, deaths over time, total cases, and total deaths. Fig. 1 shows the model and the NetLogo interface.
5. Figures
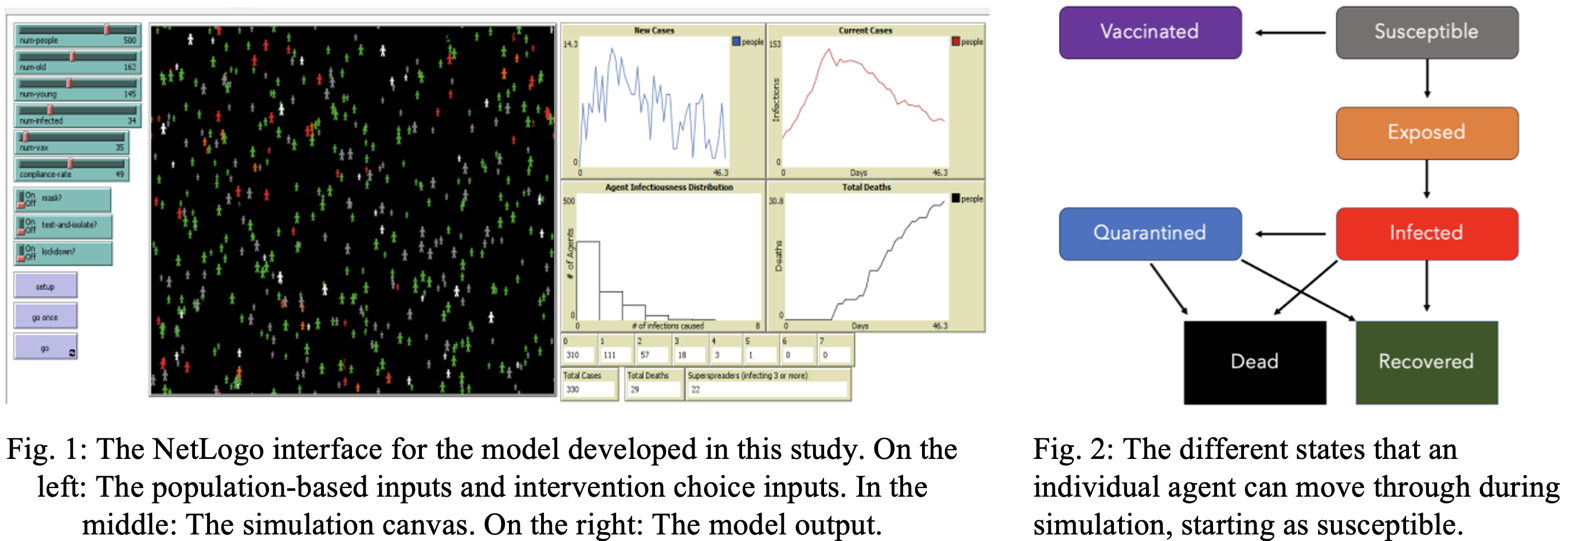
Each agent can go through seven stages of infection: susceptible, exposed (infectious but asymptomatic), infected (symptomatic), quarantined, recovered, and dead. When a susceptible agent interacts with an exposed or infected agent, they have a chance of entering the exposed state (Table 1). After passing through their incubation period, agents become infected. Agents stay infected during their recovery time, before either recovering or dying, based on the mortality rate. Recovered agents cannot become re-infected. Fig. 2 shows how the agents move between states.
This model can simulate three different non-pharmaceutical interventions: mask mandate (cloth mask), test and isolate, and lockdown. It is assumed that 75% of agents will comply [13]. To simulate a mask mandate, the infection chance of all complying agents will be reduced by 50% [18]. To simulate widespread testing, infected and symptomatic individuals who show compliance will be moved to the quarantined state, reducing their movement and interaction with other agents. To simulate a lockdown, agents showing compliance will group up into clusters of three or more then all become quarantined. The model was parameterized using published literature on COVID-19 patient outcomes (Table 1).
Table 1: The six constants used to parameterize the model and their values, some of which differ by age
|
Parameter |
Description |
Value |
Source |
|
Susceptibility |
The likelihood that an individual shows symptom after contact with an infected individual |
Age 0-20: 39% Age 21-59: 81% Age 60+: 81% |
[2] |
|
Mortality Rate |
The likelihood that an individual shows a fatal outcome during their infection |
Age 0-20: 0.1% Age 21-59: 1.4% Age 60+: 26.4% |
[12]
|
|
Recovery Time |
The time it takes for an infection to cease after symptoms arise |
Age 0-20: 13.4 days Age 21-59: 14.4 days Age 60+: 14.7 days |
[16]
|
|
Incubation Period |
The time it takes for symptoms to start after the individual is infected |
Age 0-20: 5.0 days Age 21-59: 5.8 days Age 60+: 7.6 days |
[14]
|
|
Mask Effectiveness |
The rate at which a mask reduces infectiousness (cloth mask) |
50% |
[19] |
|
Compliance Rate |
The proportion of the population that comply with intervention. |
75% |
[13] |
2.3. Procedures
2.3.1 Model Validation Test
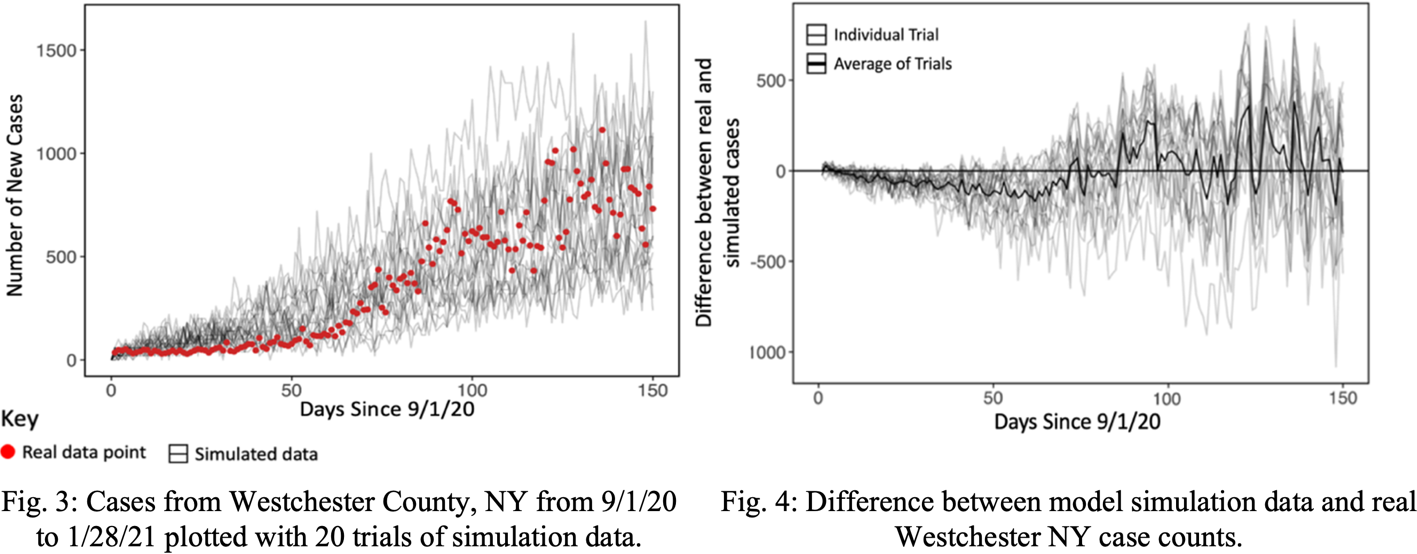
First, the model was validated against real case data from Westchester County, NY [15]. The test consisted of 20 simulations of a 150-day period from 9/1/20 to 1/28/21. The population size, population density, number of agents exposed or infected on 9/1/20, and age demographics of Westchester County were used as inputs to the model. During the simulation, masks and testing were mandated (75% compliance rate assumed) to reflect the policies in New York State at the time. The results from the simulations were compared to the real case data from the time period and graphed using the statistical programming language R [20]. The overall accuracy for the model validation was computed averaging the percent errors between real and simulated cases of all 150 days and subtracting that value from 1.
2.3.2 Sensitivity Analysis
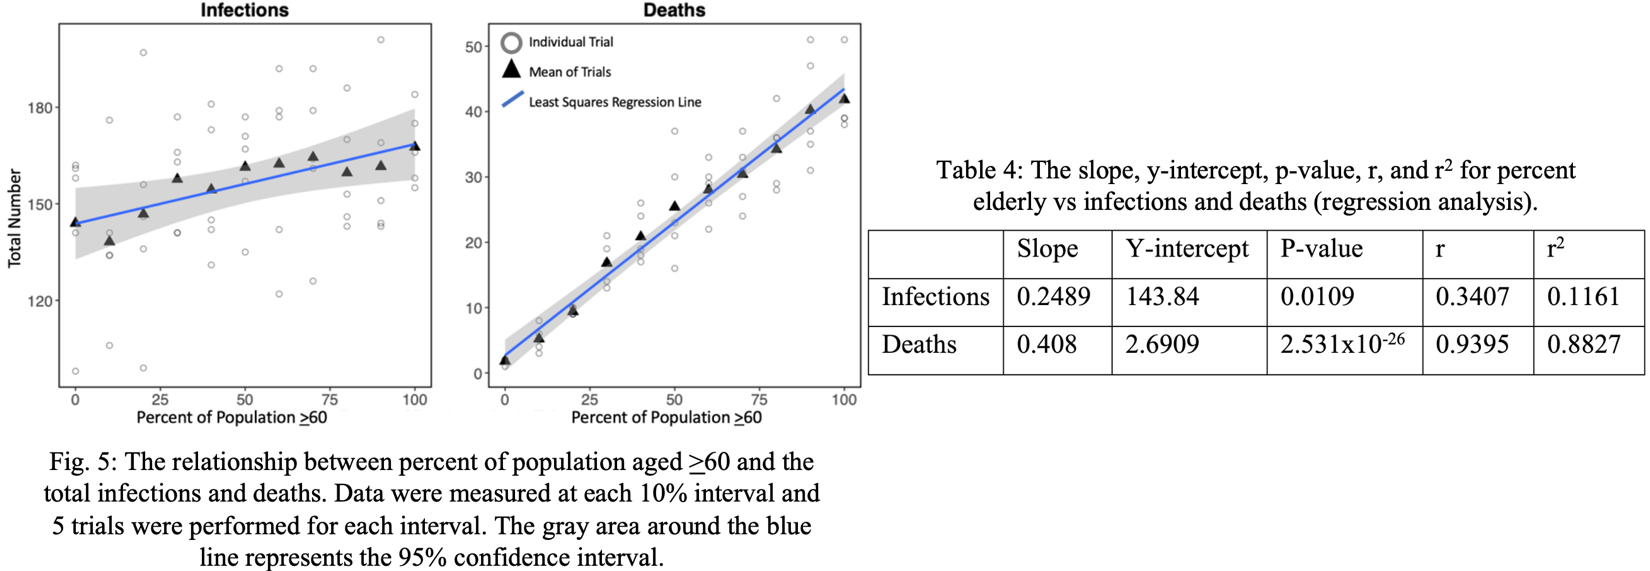
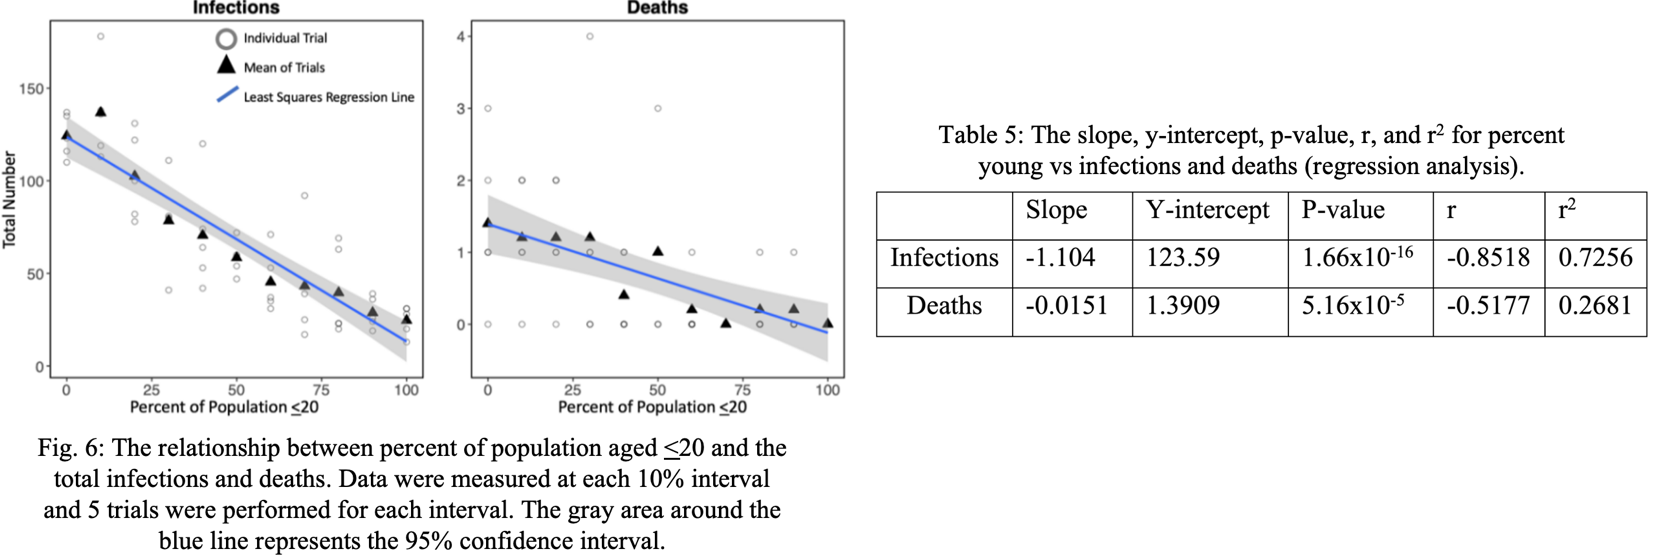
A sensitivity analysis was conducted on the proportion of population aged <20, proportion of population aged >60, vaccinations, boosters, and intervention used, with controls shown in (Table 2). In the tests with the percent elderly and percent young, 5 trials were conducted at each 10% interval. For each intervention scenario, 20 trials were conducted.
2.3.3 Comparison of Localities
Disease dynamics in four U.S. counties were compared using the model. To ensure a meaningful comparison, one county was chosen from each category of median age and vaccination rate (high age/low vaccinations, low age/high vaccinations, etc.). Data about the age demographics of each county were collected from the U.S. Census Bureau, and data about the vaccination rate of each county were collected from https://covidactnow.org/ (Table 3). In each simulation, a 500-agent sample was used to keep the population size constant across localities and a compliance rate to interventions of 75% was assumed. To observe the effects of interventions in each locality, masking, testing, and lockdowns were simulated.
2.4. Data Analysis
The data was graphed using the statistical programming language R [20]. In the sensitivity analysis, a regression analysis was performed to determine if the age distribution had a significant effect on infections and deaths. In addition, an ANOVA test was performed to determine if infections and deaths differed significantly among the three interventions simulated. A Bonferroni Correction post-hoc test was then conducted to find which interventions drove this difference.
3. Results
3.1. Model Validation Test
The model validation test showed that the real Westchester County case data was almost always within the range of the simulated data as shown in Fig. 3. The model tended to overpredict by a minor amount near the beginning of the simulation, which resolved as the simulation progressed (Fig. 4). The average error increased as the simulation progressed, which can be attributed to the increasing overall case numbers seen later in the outbreak. The overall accuracy for the model was 84.2%, calculated as the correspondence between the mean of the simulations and the real data.
Table 2: Control variables for each part of sensitivity analysis.
|
Variable |
Controls |
|
Percent Elderly (Age >60) no intervention |
Population Size: 500 Vaccination Rate: 40% Compliance Rate: 75% |
|
Percent Young (Age <20) no intervention |
Population Size: 500 Vaccination Rate: 40% Compliance Rate: 75% |
|
Vaccinations/Boosters |
Population Size: 500, Percent Young: 20% Percent Elderly: 20% |
|
Intervention Used |
Population Size: 500, Percent Yng/Eld: 20% Vaccination Rate: 0% Compliance Rate: 75% |
Table 3: Locality specific parameters for each county as of 7/14/21.
|
County |
Percent Aged 0-20 |
Percent Aged 21-59 |
Percent Aged 60+ |
Percent Vaccinated |
|
Monterey, CA |
29 |
52 |
19 |
54 |
|
Levy, FL |
21 |
45 |
34 |
32 |
|
Hunterdon, NJ |
22 |
51 |
27 |
54 |
|
Coles, IL |
24 |
54 |
22 |
33 |
3.2. Sensitivity Analysis
The results from the sensitivity analysis show that increasing the percentage of elderly in a population also increased the total infections and deaths, in effect making the outbreak more dangerous (Fig. 5). Each 1% increase in elderly subpopulation resulted in an average increase of 0.408 (P<0.05) total deaths and 0.249 (P<0.05) total infections (Table 4). The change in elderly population has a much stronger effect on the deaths than the infections with an r2 value of 0.8827 for deaths and an r2 value of only 0.1161 for infections. Overall, a population with a higher elderly subpopulation can be much more susceptible to increased infections and deaths from a COVID-19 outbreak.
However, the sensitivity analysis showed that the effect of increasing the young subpopulation had a drastically different effect on disease dynamics (Fig. 6). For each percent increase in young population, the total infections decrease by 1.104 (P<0.05) and the total deaths decrease by 0.0151 (P<0.05) (Table 5). Unlike the elderly subpopulation, the young subpopulation had a stronger effect on the infections (r2=0.7256) rather than deaths (r2=0.2681), and a more significant effect with a lower p value for infections. Overall, an increase in the young subpopulation tends to make a population less susceptible to both infections and deaths from a COVID-19 outbreak.
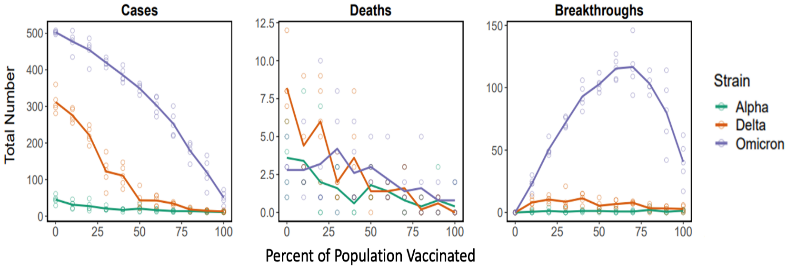
The sensitivity analysis for vaccination rate (2-dose full vaccination) was conducted for all three variants, allowing the different responses of each variant to be compared. Increasing the vaccination rate of a population decreases cases for all variants, however, Omicron produced the most cases and received the least initial reduction of cases from vaccinations (Figure 11). Vaccinations were effective in reducing deaths, and interestingly, all variants had similar levels of death after reaching ~25% of the population vaccinated. Omicron had by far the highest levels of breakthrough infections which seemed to peak at ~60% vaccination rate due to higher proportions of cases attributed to breakthroughs and decrease approaching 100% vaccination rate due to fewer total cases.
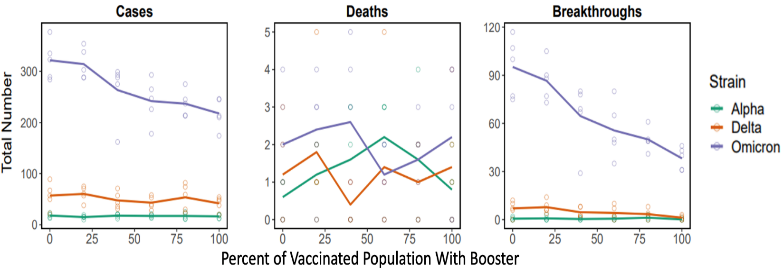
Compared to increasing 2-dose vaccinations in an unvaccinated population, increasing the rate of the third dose (booster) vaccinations in the 2-dose vaccinated population creates a weaker effect on cases and little effect on deaths (Figure 12). Nevertheless, increasing boosters affected the Omicron variant the most, likely because of the larger increase in vaccination effectiveness for that variant. Omicron variant breakthroughs are reduced effectively
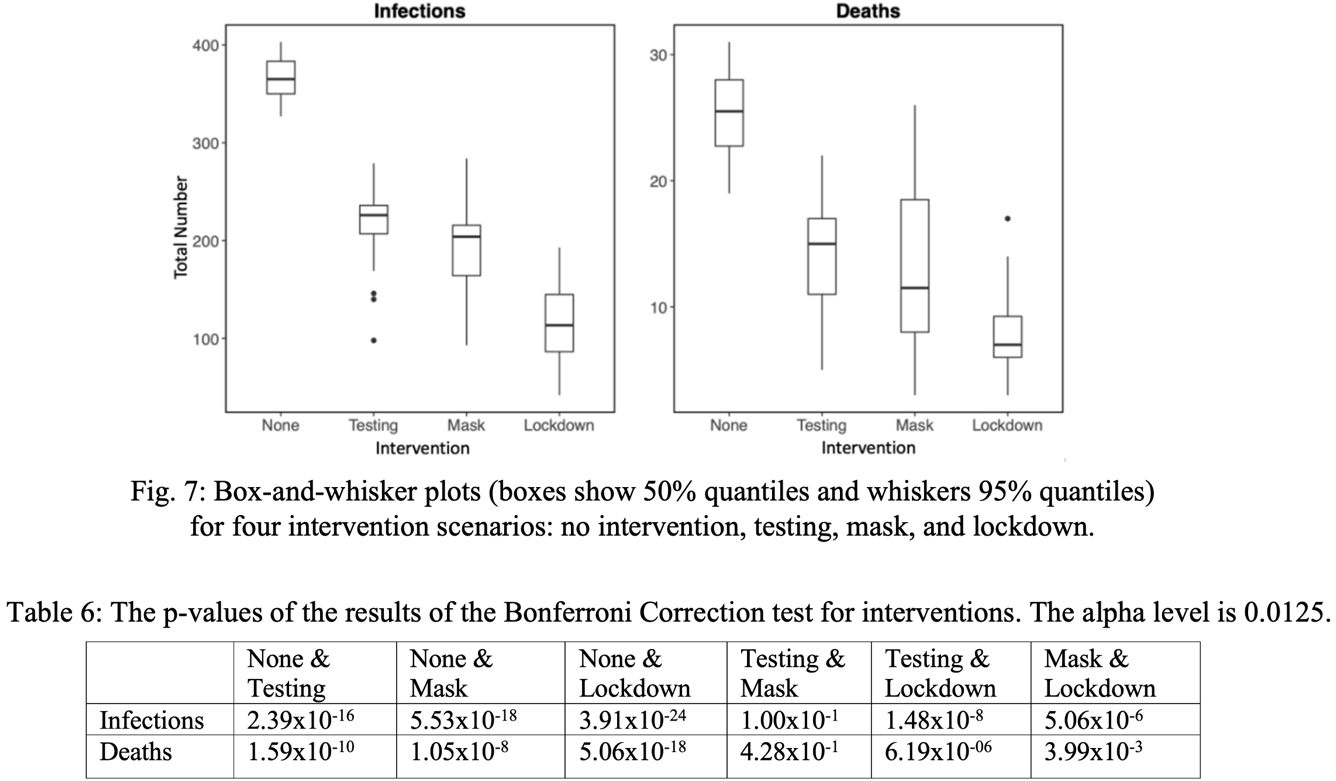
Focusing on three intervention scenarios, Fig. 7 shows that lockdowns decrease both cases and deaths the most, followed by masking and testing respectively. In the absence of both vaccination and interventions, a substantial proportion (~73%) of the population became infected, showing the necessity of interventions to control the epidemic. According to an ANOVA test, the means of the four groups differed significantly (P=1.0356x10⁻³⁰ for infections, P=1.2666x10⁻¹⁷ for deaths). A Bonferroni Correction post-hoc test with an alpha level of 0.0125 (due to 4 scenarios being present) reveals that the significant difference is mostly between the absence and presence of intervention (P<0.0125 between no intervention and every intervention); thus, all interventions – even though they differ in strength – are effective and can significantly reduce outbreak severity. There was a smaller difference between lockdown and masking (P<0.0125) but no significant difference between masking and testing (P>0.0125), showing that some interventions are more effective than others (Table 7)
3.3. Locality Comparison
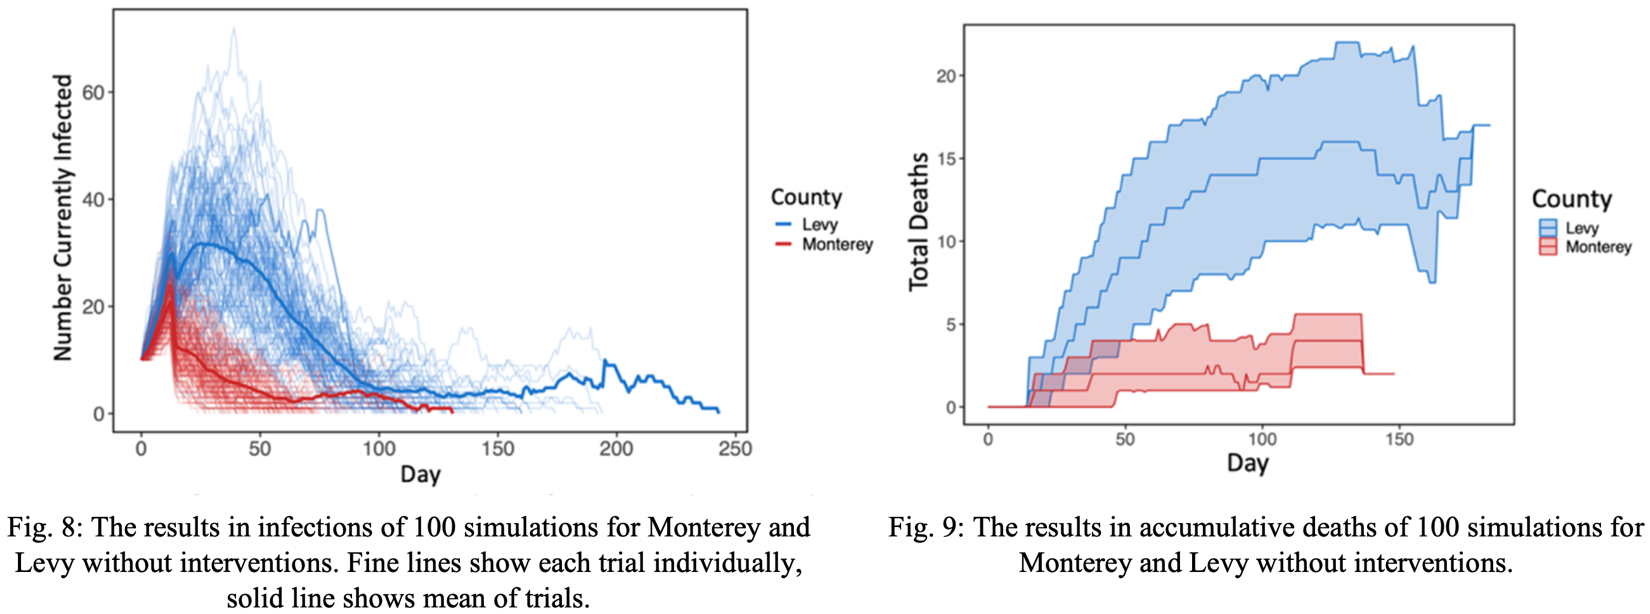
First, 100 simulations were performed for two localities – Monterey, CA and Levy, FL – without interventions. From this data, the population based on Levy County showed significantly higher disease spread than that of Monterey County. Fig. 8 shows that Levy demonstrated higher mean infection peak than Monterey, as well as a later infection peak. While the simulated infections in Monterey decreased, the simulated infections in Levy continued to increase, resulting in longer outbreaks overall. Levy also demonstrates a higher rate of death than Monterey, continuing to increase rapidly after the death increase in Monterey seemed to plateau (Fig. 9). This may be attributed to Levy’s larger elderly subpopulation.
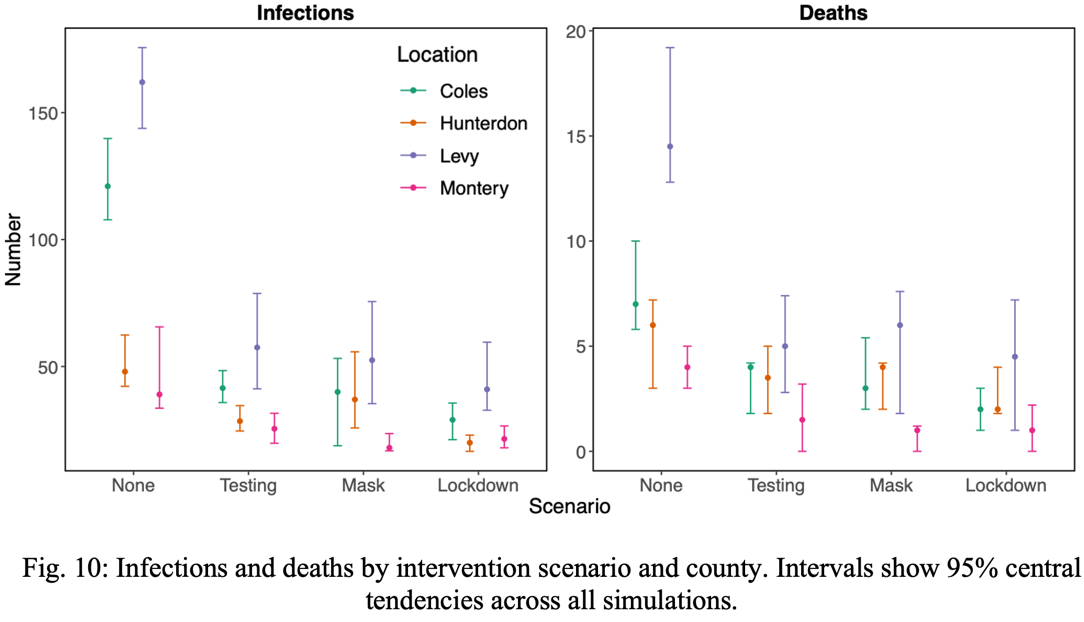
Next, outbreaks from all locations were simulated with the addition of the three intervention strategies discussed earlier: mask mandate, test and isolate, and lockdown, where it is assumed that 75% of agents will comply to each intervention. Each combination of intervention in each county was simulated 50 times; the simulated data is shown in Fig. 10. In all scenarios, counties with higher age and lower vaccinations had a more severe epidemic. However, the 95% central tendencies for both case and death count per county overlapped more often when interventions were added (Fig. 10). This observation shows that the risk level of the counties differed less with interventions than without, showing that interventions have a greater impact where the COVID-19 spread is more severe.
4. Discussion
4.1. Conclusion
In this research, a novel agent-based model was created using NetLogo to simulate disease spread within local populations, with the ability to tailor simulation to a locality based on user input. This model achieved 82.4% accuracy when validated against Westchester County case data. Comparing masking, test-and-isolate, and lockdowns, lockdowns were found to be the most effective intervention, with masking second and testing third. It was found that a higher elderly population, lower young population, lower vaccination rate, and weaker interventions were driving factors that cause some localities to have more dangerous COVID-19 outbreaks. The comparison of localities showed that interventions tend to have a higher impact in high-risk localities. he effects of age demographics on disease spread can likely be attributed to the differences in susceptibility, mortality rate, recovery time, and incubation time between age groups (Table 1). For example, susceptibility had the greatest difference from young to adult (42%), while mortality rate had the greatest difference from adult to elderly (25%). This was a major contributing factor to the effects of young and elderly population on disease dynamics and could explain why altering the young population had a greater effect on infections while altering the elderly population had a greater effect on deaths. Because interventions such as mask mandates, testing, and lockdowns differ in strength and localities differ in their population-based risk level, it may be beneficial for different localities to implement different levels of intervention based on their risk level. Through choosing the intervention most appropriate to its population, a locality can both maximize the effect of the intervention and minimize its socioeconomic cost.
4.2. Applications
This model can be used by local public health administrators as a tool to make COVID-19 related public health decisions. The novelty of this model stems from its ability to allow local health administrators to generate locality-specific data, instead of relying on state or country recommendations/guidelines to do so. While this model was parameterized for COVID-19 in this research, the model can be applied to many other infectious diseases such as influenza through changing the constants (Table 1) to that of other diseases. A website (www.localcovidmodel.org) has been created for model access.
4.3. Limitations and Future Work
One limitation to this research is that this model was built to simulate the original COVID-19 variant, which may be less infectious and more deadly than current variants, such as omicron, or future COVID-19 variants. Variants may also be more likely to cause breakthrough cases and reduce overall vaccine effectiveness. This may cause the model to underpredict cases and overpredict deaths if compared to more recent data where variants are more prevalent. In a future version of this model, the age-specific constants (Table 1) could be changed to simulate new variants. Future work could be done to explore how different variants affect disease dynamics if different actions should be taken based on the variant identified.
This model also assumes that individuals who are recovered cannot become re-infected, which may not always be true. If re-infection occurs in a population, an outbreak may last longer or cause resurgence. One way to address this issue is to convert recovered agents back to the susceptible state after a specified period of time. However, the effects this could have on a localized simulation is relatively limited, as the population size is smaller, and outbreaks typically end before agents would be eligible for re-infection. This may be a greater concern for a simulation with a larger, interconnected population.
Acknowledgements
We would like to thank Christopher Lo for his help during model development. We also would like to thank Gilana Reiss and Annmarie O’Brien for their guidance throughout the entire project. We thank Briarcliff Manor School District Superintendent Dr. James Kaishian and the Westchester County Board of Health for their support and consideration for model adoption.
References
[1] Center for Disease Control and Prevention. (n.d.). CDC Covid Data tracker. Center for Disease Control and Prevention.
[2] N. G. Davies, P. Klepac, Y. Liu, K. Prem, M. Jit, and R. M. Eggo, "Age-dependent effects in the transmission and control of COVID-19 epidemics." Nature News. (2020, June 16). View Article
[3] N. Ferguson, D. Laydon, G.Nedjati Gilani, N. Imai, K. Ainslie, M. Baguelin, S. Bhatia, A. Boonyasiri, Z. Cucunuba Perez, G. Cuomo-Dannenburg, A. Dighe, I. Dorigatti, H. Fu, K. Gaythorpe, W. Green, A. Hamlet, W.Hinsley, L. Okell, S. Van Elsland, … A. Ghani, "Report 9: Impact of non-pharmaceutical interventions (npis) to reduce COVID19 mortality and healthcare demand." Spiral. (2020, March 16).
[4] R. Fujie, and T.Odagaki, Effects of superspreaders in spread of epidemic. Physica A: StatisticalMechanics and its APPlications. (2006, September 14).
[5] [5] N. Hoertel, M. Blachier, C. Blanco, M. Olfson, M. Massetti, M. S. Rico, F. Limosin, and H. Leleu, "A stochastic agent-based model of the SARS-COV-2 epidemic in France." Nature News. (2020, July 14). View Article
[6] IHME COVID-19 Forecasting Team. Modeling covid-19 scenarios for United States. Nature News. (2020,October 23).
[7] M. P. Kain, M. L. Childs, A. D. Becker, and E. A. Mordecai, "Chopping the tail: How preventing superspreading can help to maintain COVID-19 control" . Epidemics. (2020, December 21). View Article
[8] X. Li, "Influence of different parameter on the spread of COVID-19 based on NetLogo."(2020, October 23). IEEE Xplore. View Article
[9] Person, Shyaam, Ramkumar, "AIFORGOODSIMULATOR - modeling covid-19 spread and potential interventions in refugee camps v1.0.0." CoMSES Computational Model Library. (2021, March 18).
[10] G. Pescarmona, P. Terna, A. Acquadro, P. Pescarmona, G. Russo, E. Sulis, and S. Terna, An agent-based model of COVID-19 diffusion to plan and evaluate intervention policies. arXiv.org. (2021, August 19). View Article
[11] H. Rahmandad, V. Manshadi, J. Correa, K. Kieckhäfer, A. H. Ekici, B.Rubineau, and R. J. D. Tebbens, "eterogeneity and network structure in the dynamics of diffusion: Comparing agent-based and differential equation models." Management Science. (2008, May 1). View Article
[12] C. Signorelli, and A. Odone, "Age-specific COVID-19 case-fatality rate: No evidence of changes over time." International Journal of Public Health. (2020, September 25). View Article
[13] K. A. Tamamoto, N. D. Rousslang, H. J. Ahn, H. E. Better, and R. A. Hong,"Public compliance with face mask use in Honolulu and regional variation. " Hawai'i journal of health and social welfare. (2020, September 1).
[14] W. Y. T. Tan, L. Y. Wong, Y. S. Leo, and M. P. H. S. Toh, "Does incubation period of COVID-19 vary with age? A study of epidemiologically linked cases in Singapore:" Epidemiology and infection. (2020, September 2). Cambridge Core.
[15] The New York Times. "Coronavirus in the U.S.: Latest Map and case count." The New York Times. (2020, March 3).
[16] I. Voinsky, and G. Baristaite, "Effects of age and sex on recovery from COVID-19: Analysis of 5769 Israeli patients."(2020, May 16). Define_me. View Article
[17] U. Wilensky,1999. NetLogo. http://ccl.northwestern.edu/netlogo/. Center for Connected Learning and Computer-Based Modeling, Northwestern University. Evanston, IL.
[18] C. Wolfram, (n.d.). An agent-based model of COVID-19 - Wolfram Research.
[19] S. E. Eikenberry, M. Mancuso, E. Iboi, T. Phan, K. Eikenberry, Y. Kuang, E. Kostelich, & A.B. Gumel, (2020, April 21). To mask or not to mask: Modeling the potential for face mask use by the general public to curtail the COVID-19 pandemic. Infectious Disease Modelling. View Article
[20] R Core Team (2014). R: A language and environment for statistical computing. R Foundation for Statistical Computing, Vienna, Austria.