Journal of Biomedical Engineering and Biosciences (JBEB)
ISSN: 2564-4998

Volume 2 - Year 2015 - Pages 1-11
DOI: 10.11159/jbeb.2015.001
A Probabilistic Fracture Assessment of Vertebral Cortical Bone
Isaac Mabe1 and Tarun Goswami1, 2
1Department of Biomedical, Industrial and Human Factors Engineering,
Wright State University, Dayton, OH 45435, USA
2Department of Orthopedic Surgery, Sports Medicine and Rehabilitation,
Miami Valley Hospital, Dayton, OH 45409, USA
tarun.goswami@wright.edu
Abstract - Cortical bone is a material with a porous structure. The presence of pores creates local stress concentrations and the likelihood of premature failure. Assuming that pores are present in all bone, vertebral endplates, for example, can subside. Subsidence has taken place at rates as high as 77 percent. A computational probabilistic assessment of the pore size distribution and their contribution to the fracture toughness has been presented in this paper. A Monte Carlo simulation was used to develop and assign random pores. Also the model compared crack sizes to the thickness of the cortical bone present as a limiting case. The a/W (crack length to specimen depth) ratio was a controlling parameter for the fracture case in support of ASTM 399 and published models were used in this research with probabilistic distribution of pores. The probabilistic analyses presented a conservative solution and may be applicable in medical device design.
Keywords: Failure, Vertebral Bodies, Finite Element Modeling, Strain, Cervical Spine.
© Copyright 2015 Authors - This is an Open Access article published under the Creative Commons Attribution License terms. Unrestricted use, distribution, and reproduction in any medium are permitted, provided the original work is properly cited.
Date Received: 2014-10-14
Date Accepted: 2015-02-12
Date Published: 2015-03-05
1. Introduction
The cervical spine is a complex section of the spinal column. It has several components that work together to provide humans with a large range of motion [1-8] in the neck and protects the spinal cord. Therefore, the recent literature shows how to ensure the health, strength and mechanical properties of the vertebrae [9-28]. The objective of this research is to expand fracture toughness considerations in cortical bone. Inherent challenges with these types of studies involve varying structures of the cortical bone and the interfacial regions between cortical and the trabecular structure. Several features create voids in cortical bone including Haversian canals, Volkmann's canals canaliculai and randomly distributed pores.
Several studies have investigated the limit of the fracture toughness of cortical bone [9-16]. The stress intensity factor of bone can be described in terms of longitudinal and transverse fracture toughness. Longitudinal stress intensity is associated with the long axis of long bones, i.e. the femur. Irregular bones specifically the vertebrae have a less well defined longitudinal and transverse direction. Physiologically the load sharing between the trabecular core and the endplate is complex phenomena. When a healthy disc is present, the endplate is loaded under tensile stresses. However, when the disc is replaced the forces transferred cause a compressive stress in the endplate. However, some regions of the endplate may experience tension [29]. The cortical endplate of the vertebral body was modeled assuming a simply supported beam, to determine the strength of the endplate and its mechanical behavior.
A probabilistic assessment of the toughness was developed in the presence of pores [30]. The pores were assumed from femur studies compiled from literature [31-34] and assumed normally distributed. The probabilistic methodology developed here considers fracture toughness limits. A beam model was constructed with predefined cracks present in the tension region of a beam. The tension region of a simply supported beam is the area opposite side of the neutral axis from the load. The beam models were also considered plain stress models. Four fracture models were considered that defined the stress intensity at crack tips. Three of these models Vashishth [12], Dowling [35] and Feng [15] considered compact tension fracture, in plane strain conditions. The fourth model was a three point beam bending model constructed by Yan [13]. The crack size was examined to determine the probability when it would exceed the fracture toughness of the bone.
2. Methods
A unit width was assumed with an initial beam length to simplify calculation steps. A mid-sagittal section was assumed with a thickness function that was developed from studies of the endplate measurements. As a result the cross sectional area varied in depth only with position along the beam length. A second order polynomial fit was developed applied to the data presented in Table 1. The model is consistent with findings of the cortical endplate distributions. The thickest regions are the peripheries of the endplates or the ends of the beam by the support and the thinnest regions of the endplate are in the center or the middle of the beam. Once the geometry was established, an assumption was made for the elastic modulus of the cortical bone. Several values were investigated and the typical range is between 16-20 GPa. This model uses 18.6 GPa as the modulus of elasticity (E). The beam is assumed to behave linear elastically. Modulus data is presented in Table 2.
Table 1. Thickness data collected from anthropometric vertebral studies. Thicknesses measured along the mid-sagittal plane.
| Mid-Sagittal Vertebral Endplate Thicknesses (mm) | |||||||||||
| % | Pitzen36 | Edwards37 | Hulme38 | Panjabi39 | Inf | Sup | Tot | ||||
| Inf | Sup | Inf | Sup | Inf | Sup | Inf | Sup | Ave | Ave | Ave | |
| -40 | 1.025 | 1.198 | 0.468 | 0.39 | 0.85 | 0.95 | - | - | 0.781 | 0.846 | 0.813 |
-25 |
- | - | - | - | - | - | 0.558 | 0.796 | 0.558 | 0.796 | 0.677 |
-20 |
0.85 | 0.9825 | 0.35 | 0.374 | 0.5 | 0.6 | - | - | 0.567 | 0.652 | 0.609 |
| 0 | 0.6825 | 0.715 | 0.374 | 0.392 | 0.37 | 0.42 | 0.594 | 0.502 | 0.505 | 0.507 | 0.506 |
| 20 | 0.9425 | 0.815 | 0.362 | 0.38 | 0.38 | 0.41 | - | - | 0.562 | 0.535 | 0.548 |
| 25 | - | - | - | - | - | - | 0.698 | 0.524 | 0.698 | 0.524 | 0.611 |
| 40 | 1.12 | 0.868 | 0.394 | 0.384 | 0.8 | 0.75 | - | - | 0.771 | 0.667 | 0.719 |
Table 2. Elastic modulus of bone specimens and the method by which they were determined '*' indicates information summarized by Bayraktar [20].
| Reference | Region | Method | Elastic Modulus (GPa) |
| *Ulrich21 | Femur Head | Experimental - FEA | 3.5-8.6 |
| Rho19 | Vertebral Trabeculae, Transverse | Nanoindentation | 13.4 |
| Tibia Osteon - Longitudinal | Nanoindentation | 22.5 | |
| Tibia Lamallae - Longitudinal | Nanoindentation | 25.8 | |
| *Hou22 | Vertebrae | Experimental - FEA | 5.7 |
| *Ladd40 | Vertebrae | Experimental - FEA | 6.6 |
| *Turner24 | Distal Femur | Nanoindentation | 18.1 |
| *Zysset25 | Femur Neck | Nanoindentation | 11.4 |
| *Niebur41 | Bovine Tibia | Experimental - FEA | 18.7 |
| Bayraktar20 | Femur Neck | Experimental - FEA | 18.0 |
| Roy23 | Endplate - Coronal | Nanoindentation | 18.0 |
| Endplate - Sagittal | Nanoindentation | 18.0 | |
| Cortical Shell - Transverse | Nanoindentation | 18.0 | |
| Axial Trabeculae - Longitudinal | Nanoindentation | 22.72 | |
| Radial Trabeculae - Longitudinal | Nanoindentation | 16.3 | |
| Circumfrential Trabeculae | Nanoindentation | 15.7 |
The following assumptions were made for this paper; cortical bone acts as an isotropic, homogenous, linear elastic material, the endplate behaves like a beam, the radial cortical shell provides pinned supports for the beam, single cracks are normally distributed, influence of cracks do not interact with each other, shape factors for compact sections apply to individual beam segments, the shape function for the beam applies to cracks at any position x, and finally uniaxial stress conditions prevail.
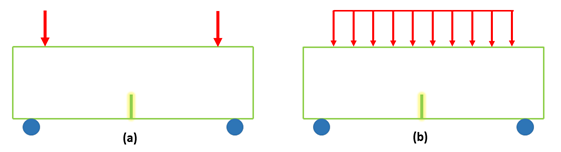
Two load cases were considered as shown in figure 1:
Load Case I
- - Simply supported beam
- - Pin/roller supports
- - Two symmetrically placed static point loads
- - Load simulates disc with poor placement mismatch of implant and vertebrae radius
Load Case II
- - Simply supported beam
- - Pin/roller supports
- - Uniformly distributed static load
- - Load placed symmetrically on middle 3/4 of beam
- - Load simulates disc with good implant and vertebrae radius match
The load applied to the beam is of equal force for both cases. It is distributed in two different conditions as previously described. The first case models an implanted disc in contact with the vertebral body in only two points of contact (simulating drastic curvature differences the design aid of two equal concentrated loads symmetrically placed was used) and the second with complete contact between an artificial disc and vertebral body (where contact is continuous along the length of the implant the uniform load partially distributed design aid was used.). Physiologically the vertebral body shares load between the cortical shell and the trabecular core [38]. The magnitude of the load at a minimum comes from the head and the contribution of the length of the neck to the level of the vertebrae under consideration. Conservatively the entire length of the neck and the weight of the head can be considered to act on the superior endplate of the vertebrae [42].
The actual load applied was a static load of 200 N. The load is also considered purely static without cycling. According to anthropometric measurements the weight of the head and neck is 8 percent of the total body weight of the person under consideration [42]. For a 200 pound person that head and neck segment weighs 16 pounds. In SI units the head and neck weighs 71.2 N. This is just the load from the head and neck which the spine sees constantly in an upright position. A larger load was considered to investigate more extreme loads. 200 N was used as a benchmark. An endplate width and depth was estimated from measurements taken of the cervical spine [43]. A depth of anterior to posterior was estimated at 20 mm. If it is assumed that the entire endplate distributes load evenly then on a per unit width the 200 N load is divided by 20 mm giving 10 N/mm through the depth. Since this theoretical beam is 1 mm thick the load applied to the unit width under investigation is 10 N. This ensures KIc from reported literature can be used as opposed to a lower KIc due to cyclic loading.
The stress was calculated through the length of the beam assuming basic beam bending equations in which planar sections remain plane. This was done to limit the crack opening stresses in the transverse plane and eliminating shear that would cause the opening of cracks in directions inducing Mode II or Mode III behavior. The random pore distribution from cortical femur bone was used to develop a distribution of pores within the vertebrae. Pore sizes in the vertebrae were assumed consistent with femur data [31-34]. This information was used as a basis to form a crack. The pores from the data were assumed to be circular. This allowed for the calculation of the diameter of the pore that was used as the basis of the length of the crack. The diameter was then considered the nonunion of adjacent differential slices on the beam in the tension section creating a sharp, through edge crack condition. This crack length was important in Mode I crack opening and respective stress intensity factors. The crack was also considered a small edge crack in a homogenous material. The crack direction was perpendicular to the beam section at every point consistent with transversely oriented pores in vertebral cortical bone [19]. A Monte Carlo extension module, RiskAMP [44] (Structured Data, New York), was used to create the crack simulation. RiskAMP is a random number generator. A truncated normal distribution was used to generate the crack lengths. It consisted of a mean, standard deviation, maximum and minimum crack length. This model assumed a crack from a sample size of 500. The Monte Carlo simulator establishes the crack distribution parameters for every crack position along the length of the beam. The large number means the distributions are consistent in terms of mean and standard deviation. Secondly, it increases the accuracy of the results. Porosity data is presented in Table 3.
The initial crack length is established the stress intensity was calculated for each of the initial crack lengths. Four models were developed following ASTM standards [13-16, 45]. Each of the models introduced a shape function: Norman [14] and Feng [15] used a shape function for the stress intensity factor developed by Behiri and Bonfield. Others [16,35] used a compact tension shape function while Yan used a three point beam bending function per ASTM E-399 [45].The shape functions were, with respect to Mode I crack opening, in terms of 'a', the initial crack length, and W the width of the specimen at that point. In this case the specimen width corresponds to the height of the beam. While the previously mentioned models are a function of a/W the Dowling model is a function of x position along the beam. Therefore the beam was divided into 100 differential slices with which to determine the stress intensity. The same spots were used with each respective a/W ratio for comparison.
Each of these shape functions and test methods had specific specimen size requirements on them according to ASTM E399 testing standards. Typically the requirement for a/W is in the range of 0.45 to 0.55. Feng [15] expanded the a/W initial condition to 0.7. Other studies have shown that an increase in the ratio of a/W (longer initial crack) increases the resulting Kc value with that associated initial condition. ASTM E399 [45] recommends test specimen configuration. The point of load application is where W is considered to start when measuring the ratio of a/W. This theoretical model assumes that the load application to each compact specimen is supplied by a bending moment perpendicular to the crack orientation. The beam model has restrictions on the size of the span to width of the specimen. This ratio is on the order of 4 to 5. It was assumed that the equations would hold for the decreased specimen width and plain strain conditions prevail.
Table 3. Pore data set used to develop truncated normal distribution.
| Haversian Canals Area (µm2) | Osteon Canals Area (µm2) | Average Porosity Area (µm2) | Average Measured Porosity (percentage) | ||
| Wacther34 | Max Min Average |
31244 665 4157 |
63959 26390 41621 |
101337 3100 19863 |
26 4 9.1 |
| Wang33 | Max Min Average |
4717 577 263 |
9657 22890 26362 |
15300 2689 12581 |
- - - |
| Fazzalari31 | Average | 13704 | 137210 | 65481 | 30 |
| Bell32 | Average | 5510 | 55170 | 26329 | 12.1 |
An initial crack length 'a' was estimated and corresponding stress intensity factor calculated. A limit crack length was then determined based on the fracture toughness of transverse cortical bone. Once the critical crack length was determined the probability of a crack existing with a shorter length was determined. The analysis shows Haversian canals long axis oriented in the axial plane [46]. Because of the orientation of the osteons cracks would grow perpendicular to the long axis of the osteon. However when a crack grows into an osteon, it would wrap around the osteon thereby increasing the stress intensity value as compared to a crack growing parallel to the osteons long axis, crack would open the osteons like a zipper. Once the size of the transition crack length was determined a comparison made to the distribution of cracks at the same spot along the beam developed by the Monte Carlo simulations.
3. Results
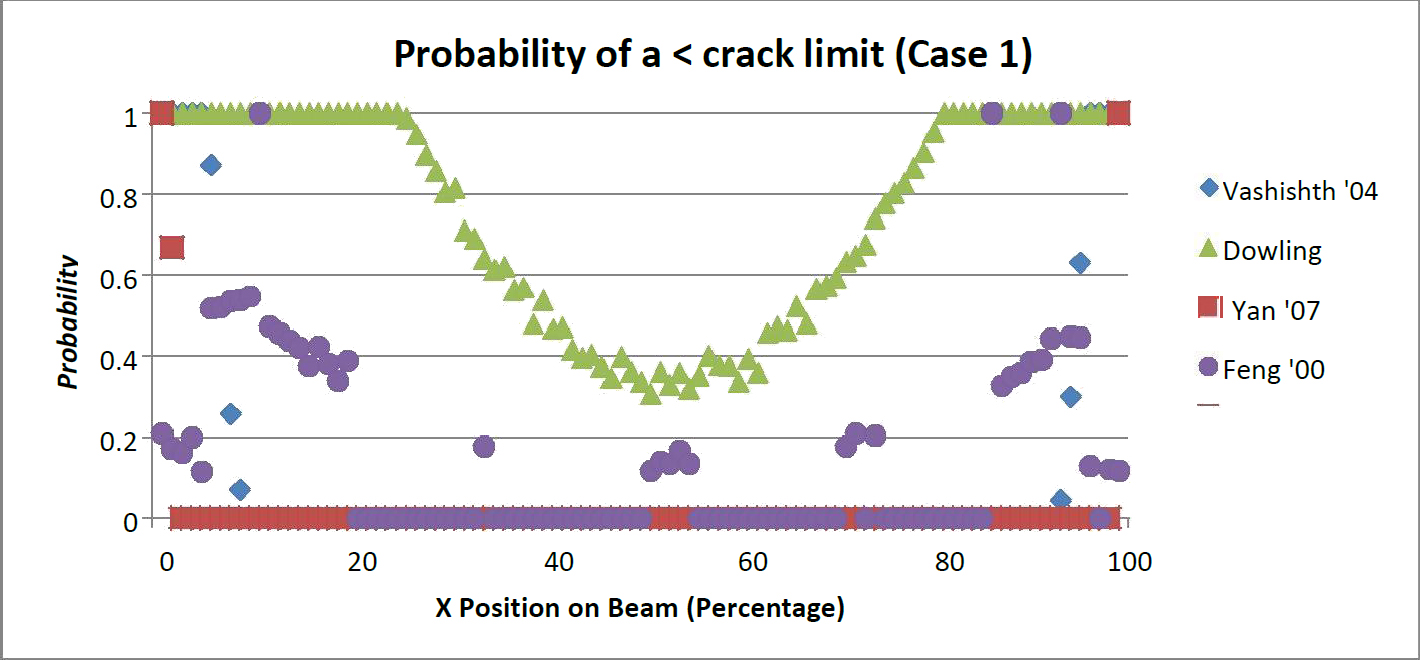
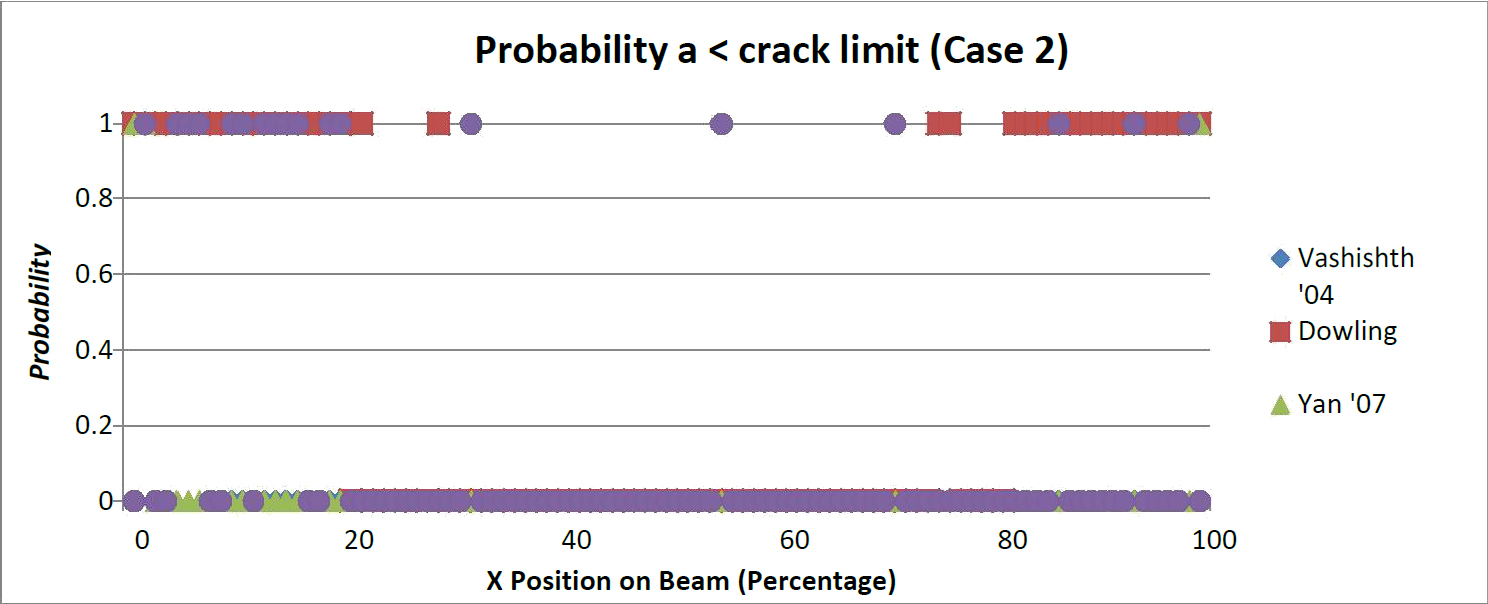
The probability of a crack length shorter than the critical length was determined for both, Load Case 1 and Load Case 2. These results are shown in Figures 2 and 3. It can be seen that the Yan beam model [16] is the most conservative model. For case 1 and case 2, 90 percent of the beam was too thin for the presence of any crack. Stated another way the minimum length of cracks sizes present created an a/W ratio was too large for the depth of the beam at the corresponding point. A three point beam model does not accurately reflect the support of the trabecular core, which reduces the span length. While the support is not the same as in a bend test a modification to the span coefficient may yield results closer to that of the other model.
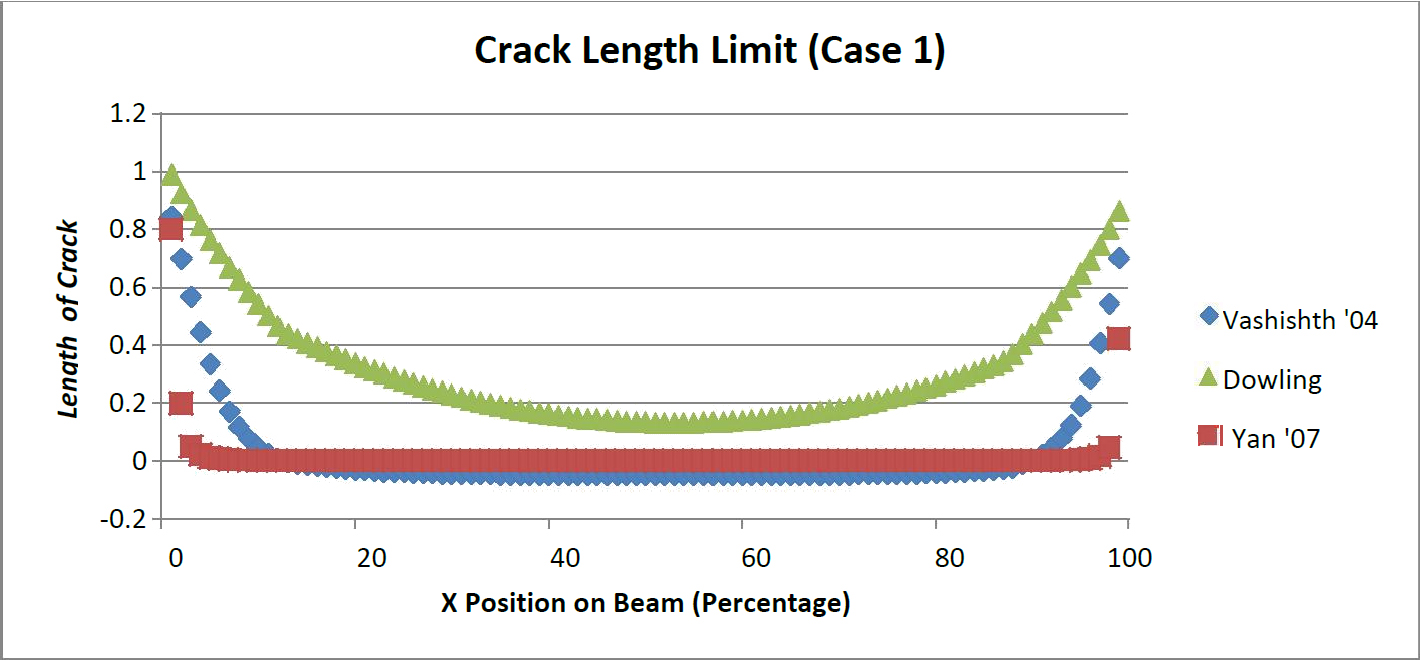
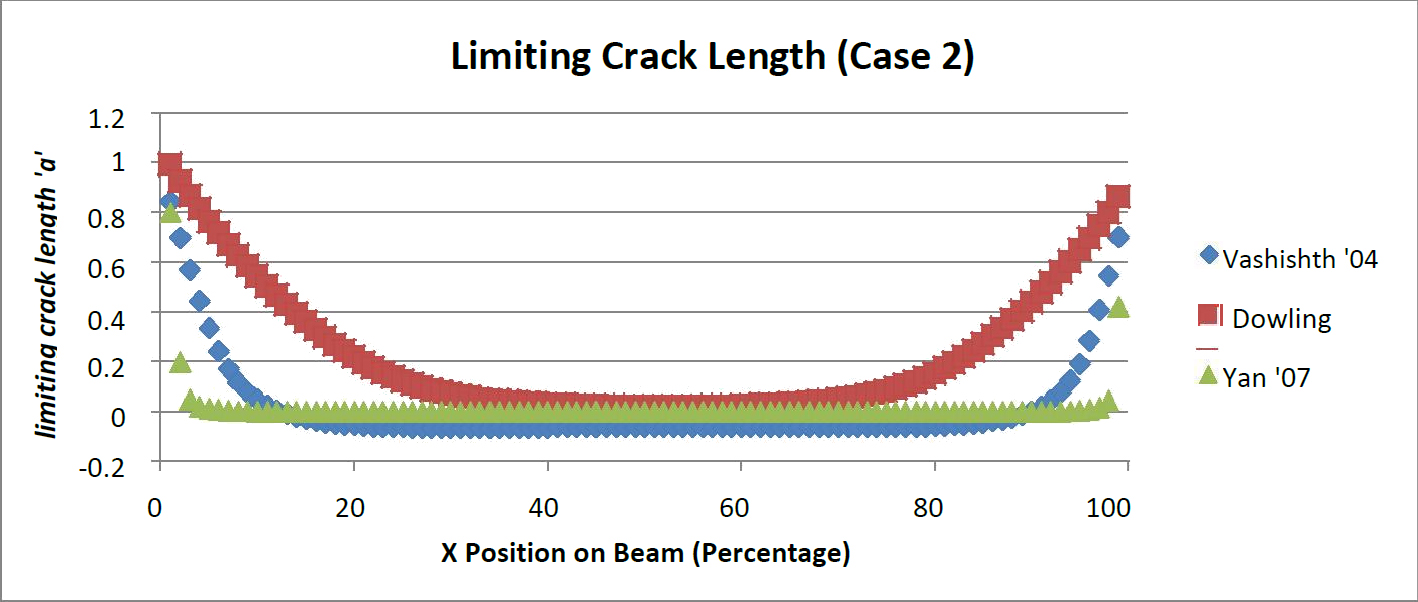
Corresponding to the position of the beam allowable crack length values were presented for the two load cases (Figures 4 and 5). A critical crack length was determined by solving for the crack length at the transverse critical stress intensity. Yan's model [13] was the least likely to have subcritical crack lengths, with the exception of small distances from the supports. Additionally Dowling's model is the most likely to have a subcritical crack present with Vashishth's model in the middle.
For both load crack present would be critical thereby exceeding the critical transverse stress intensity. Dowling's mode scenarios it is clear that all three models show similar behavior. Vashishth's model [16] indicates that a large portion of the beam model would contain subcritical cracks. However towards the center of the beam negative crack lengths arose. This indicates any l [35] created a ceiling for the amount of permissible cracks. The crack limit threshold was also greater for every point along the beam than the Vashishth and Yan models.
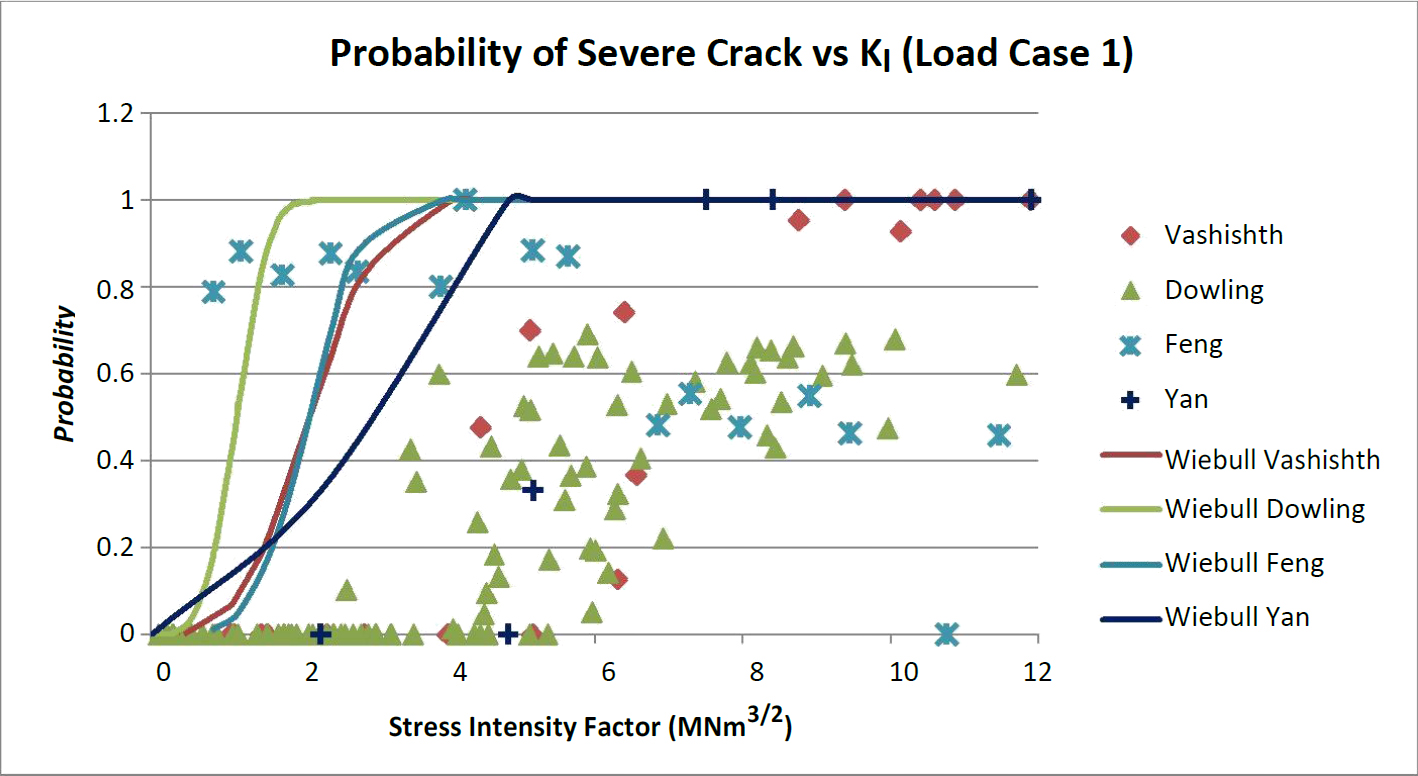
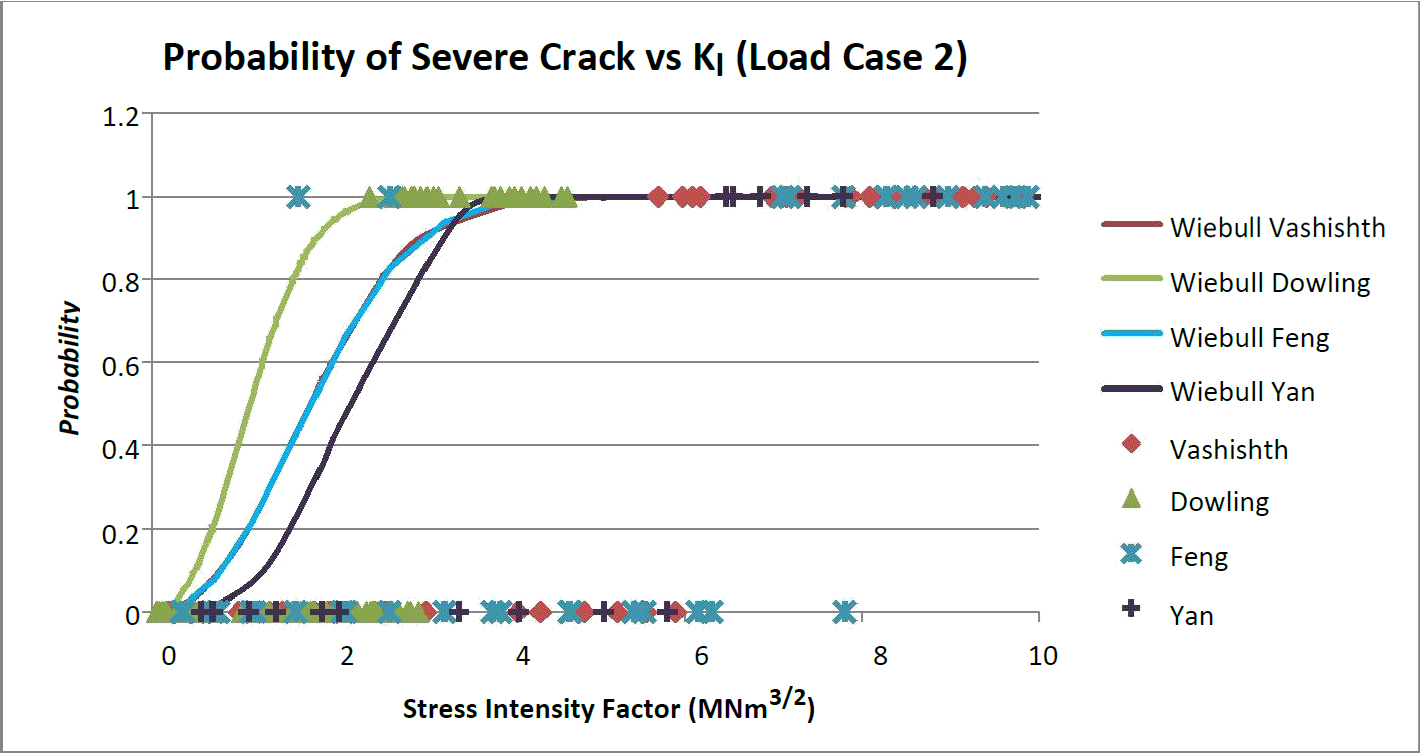
Figures 6 through 7 show the probability of the presence of a supercritical crack. For both load case 1 and 2 data is accumulated around 6 MNm3/2. This indicates that at each stress intensity value there is a probability of exceeding or not exceeding bone's transverse critical stress intensity. When a prediction equation is fit to the data the trends for all four fracture models using the probabilistic methods were to the left hand side of a majority of the original models. This indicates a conservative prediction for the existence of a supercritical crack. This would mean that device design based on this method would be more conservative in predicting subsidence and the onset of yielding and/or fracture. For both load cases 1 and 2 the most conservative prediction model was Dowling's model followed by a close tie between Feng and Vashishth's model with Yan's model being the least conservative.
4. Discussion and Conclusion
This research develops a probabilistic assessment method for determining the presence of cracks of sufficient length to exceed the critical fracture toughness of bone. This technique is needed because the porous structure of bone causes stress concentrations that initiate failure before bone reaches its yield stress. This is important because bone failure cannot be characterized by yield mechanics of gross material properties alone. The work expands bone fracture research to a non ASTM standard model. This expanded work increases the applicability of the fracture work to areas of biological crack mechanics not well described by ASTM specimen size requirements. It also establishes the presence of pores that change the type of failure that is considered mechanically
This model assumes that plain strain stress intensity applies to the beam model because of the size constraints of the vertebral cortical bone. It was assumed that there would be no interaction between plain strain and plain stress. Mode I is assumed to act independently of Mode's II and III. The entire applied load was considered to activate Mode I only. The Vashishth '04 [16] model predicts 52% of the Case 1 and 65% of the Case 2 beams cannot meet a minimum required crack limit. The Dowling, which is also based on a compact tension model, has the highest probability of a crack below the fracture limit. In Case 1 the entire beam had a chance of the strength being governed by yielding. This is most likely due to the maximum moment. The max moment from Case 1 is 12.5 Nmm while the max moment for Case 2 is 31.3 Nmm. While the load was the same the moment distribution tends to increase. Dowling's model also consists of a discrete moment at each section of the beam. This moment can be found directly from the bending equations.
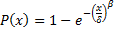
Differences in the probability are most likely attributed to the shape factor. Feng's models have an entirely random distribution that seems to be more dependent on crack length than it does on the amount of stress at each point. The Feng model differs from the previous three models in this respect. The other three models tend to be more dependent on the stress applied to the differential sections as opposed to being controlled by the crack length as with the Feng model. The Yan beam model [13] is the least conservative limit in both case 1 and case 2 for the stress intensity factor. This seems to be due in strong part to the span multiplier present in the equation for KI. For the case of vertebral endplate tissue separated from the cancellous core, a value of 20 mm would be correct if compared to three-point beam testing. This is an overestimate of the stress intensity value at points along the length because the trabecular core supports the vertebral endplate at intervals closer than the 20 mm span. The stress intensity values calculated by the Vahishth and Feng models are the most similar with the Dowling model being the least conservative model for both load case 1 and 2. The shape function of Dowling's model undervalues applied stress compared to other models. That does not necessarily mean that a crack above the crack limit threshold exists there. The probability of exceeding the threshold crack limit was calculated verse the KI value. A Weibull cumulative distribution plot (CDF) was used to describe the probability as a function of KI. The Weibull equation and the probability domain were graphically cut off after the point at which the crack threshold maintained 100% probability. This theoretical model produced the probability of a threshold crack based on a limiting Kc of 6 MNm3/2. The randomized values are grouped around the transverse Kc limit of 6. The probability of a sufficient crack was fit with a Weibull continuous distribution function (CDF) [47] in the form of the equation:
This model is also limited to Mode I, tensile, failure. Bone is subjected to more than tensile forces. Expanding the study to consider Mode II and III fracture and the associated probabilities of fracture would improve bone strength assessments. This research does not consider the overall reduction in strength; however, it could be included in the analysis as a reduction to bending stress or deflection limits. It is also recommended to further examine the length multiplier for the Yan beam model. A shorter unsupported length would give more a representative stress intensity values per crack length.
References
[1] Boos N. and Aebi M., "Spinal Disorders, Fundamentals of Diagnosis and Treatment," Springer-Verlang, Berlin Heidelberg, pp. 41-66, 2008. View Article
[2] Penning L. and Wilmink J.T., "Rotation of the Cervical Spine: A CT Study in Normal Subjects," Spine, vol. 12, no. 8, pp. 37-47, 1987. View Article
[3] Lind B., Sihlbom H., Nordwall A., Malchau H., "Normal Ranges of Motion of the Cervical Spine," Archives of Physical Medicine and Rehabilitation, vol. 70, pp. 692-695, 1989. View Article
[4] Dvorak J., Penning L., Hayek J., Panjabi M.M., "Zehnder R.I. Functional Diagnostics of the Cervical Spine Using Computer Tomography," Nueroradiology, pp. 132-137, 1988
[5] Aho A, Vartiamen O, Salo O., "Segmentary Antero-Posterior Mobility of the Cervical Spine," Annales Medicine Internae Fenniae, vol. 44, pp. 287-299, 1955. View Article
[6] Bhalla S.K., Simmons E.H., "Normal Ranges of Intervertebral Joint Motion of the Cervical Spine," Can. J. of Surgery, vol. 12, pp. 181-187, 1969. View Article
[7] Wheeldon J.A., Pintar F.A., Knowles S., Yoganandan N., "Experimental Flexion/Extension Data Corridors for Validation of Finite Element Models of the Young, Normal Cervical Spine," J. of Biomechanics, vol. 39, pp. 375-380, 2006. View Article
[8] Galbusera F., Bellini C.M., Costa F., Assietti R., Fornari M., "Anterior Cervical Fusion: A Biomechanical Comparison of 4 Techniques," J. of Nuerosurgery: Spine, vol. 9, pp. 444-449, 2008. View Article
[9] Behiri J.C. and Bonfield W., "Orientation Dependence of the Fracture Mechanics of Bone," J. of Biomechanics, vol. 22, pp. 863-872, 1989. View Article
[10] Behiri J.C. and Bonfield W., "Crack Velocity Dependence of Longitudinal Fracture in Bone," J. of Material Sci., vol. 15, pp. 1841-1849, 1980. View Article
[11] Behiri J.C. and Bonfield W., "Fracture Mechanics of Bone - The Effects of Density, Specimen Thickness and Crack Velocity on Longitudinal Fracture," J. of Biomechanics, vol.17, pp. 25-34, 1984. View Article
[12] Vashishth D., Behiri J.C., Bonfield W., "Crack Growth Resistance in Cortical Bone: Concept of Microcrack Toughening," J. of Biomechanics, vol. 30, pp. 763-769, 1997. View Article
[13] Yan J., Mecholsky J.J., Clifton K.B., "How Tough is Bone? Application of Elasticplastic Fracture Mechanics to Bone," Bone, vol. 40, pp. 479-484, 2007. View Article
[14] Norman T.L., Vashishth D., Burr D.B., "Fracture Toughness of Human Bone Under Tension," J. of Biomechanics, vol. 28, pp. 309-320, 1994. View Article
[15] Feng Z., Rho J., Han S., Ziv I., "Orientation and Loading Condition Dependence of Fracture Toughness in Cortical Bone," Materials Sci. Eng. C, vol. 11, pp. 41-46, 2000. View Article
[16] Vashishth D., "Rising Crack-Growth-Resistance Behaviors in Cortical Bone: Implications for Toughness Measurements," J. of Biomechanics, vol. 37, pp. 943-946, 2004. View Article
[17] Biewener A.A., "Safety Factors in Bone Strength," Calcified Tissue Int., vol. 53, pp. S69-S74, 1993. View Article
[18] Mossekilde L., "Vertebral Structure and Strength In Vivo and In Vitro," Calcified Tissue Int., vol. 53, pp. S121-S126, 1993. View Article
[19] Rho J.Y., Tsui T.Y., Pharr G.M., "Elastic Properties of Human Cortical and Trabecular Lamellar Bone Measured by Nanoindentation," Biomaterials, vol. 18, pp. 1325-1330, 1997. View Article
[20] Bayraktar H.H., Morgan E.F., Niebur G.L., Morris G.E., Wong E.K., Keaveny T.M., "Comparison of the Elastic and Yield Properties of Human Femoral Trabecular and Cortical Tissue," J. of Biomechanics, vol. 37, pp. 27-35, 2004. View Article
[21] Ulrich D., Hildebrand T., Van Rietbergen B., Muller R., R-uegsegger P., "The Quality of Trabecular Bone Evaluated with Micro-Computed Tomography, FEA and Mechanical Testing," Stud. in Health Technol. and Informatics, vol. 40, pp. 97-112, 1997. View Article
[22] Hou F.J., Lang S.M., Hoshaw S.J., Reimann D.A., Fyhrie D.P., "Human Vertebral Body Apparent and Hard Tissue Stiffness," J. of Biomechanics, vol. 31, pp. 1009-1015, 1998. View Article
[23] Roy M., Rho J.Y., Tsui T.Y., Pharr G.M., "Variation of Young's Modulus and Hardness in Human Lumbar Vertebrae Measured by Nanoindentation," In Proc. of the Bioengineering Conf., Atlanta, GA, ASME BED, vol. 33, pp. 385-386.
[24] Turner C.H., Rho J., Takano Y., Tsui T.Y., Pharr G.M., "The Elastic Properties of Trabecular and Cortical Bone Tissues are Similar: Results from Two Microscopic Measurement Techniques," J. of Biomechanics, vol. 31, pp. 1187-1192, 1998. View Article
[25] Zysset P.K., Guo X.E., Hoffler C.E., Moore K.E., Goldstein S.A., "Elastic Modulus and Hardness of Cortical and Trabecular Bone Lamellae Measured by Nanoindentation in the Human Femur," J. of Biomechanics, vol. 32, pp. 1005-1012, 1999. View Article
[26] Kopperdahl D.L. and Keaveny T.M., "Yeild Strain Behavior of Trabecular Bone," J. of Biomechanics, vol. 31, pp. 601-608, 1998. View Article
[27] Hansson T.H., Kelles T.S., Panjabi M.M., "A Study of the Compressive Properties of Lumbar Vertebral Trabeculae: Effects of Tissue Characteristics," Spine, vol. 11, pp. 837-844, 1987. View Article
[28] Eswaran S.K., A. Gupta, M. F. Adams, and T. M. Keaveny, "Cortical and Trabecular Load Sharing in the Human Vertebral Body," J. of Bone and Mineral Res., vol. 21, no. 2, pp. 307-314, 2006. View Article
[29] Eswaran S.K., A. Gupta, T.M. Keaveny, "Locations of Bone Tissue at High Risk of Initial Failure During Compressive Loading of the Human Vertebral Body," Bone, vol. 41, pp. 733-739, 2007. View Article
[30] Shi X., Liu S., Wang X., GuoX. E., Niebur G.L., "Effects of Trabecular Type and Orientation on Microdamage Susceptibility in Tarbecualar Bone," Bone, vol. 46, pp. 1260-1266, 2010. View Article
[31] Fazzalari N.L., Parkinson I.H., Fogg Q.A., Sutton-Smith P., "Antero-Postero Differences in Cortical Thickness and Cortical Porosity of T12 to L5 Vertebral Bodies," Joint Bone Spine, vol. 73, pp. 293-297, 2006. View Article
[32] Bell K.L., Loveridge N., Power J., Garrahan N., Meggitt B.F., Reeve J., "Regional Differences in Cortical Porosity in the Fractured Femoral Neck," Bone, vol. 24, pp. 57-64, 1999. View Article
[33] Wang X. and Ni Q., "Determination of Cortical Bone Porosity and Pore Size Distribution Using a Low Field Pulsed NMR Approach," J. of Orthopaedic Res., vol. 2, pp. 312-319, 2003. View Article
[34] Wachter N.J., Augat P., Krischak G.D., Mentzel M., Kinzl L., Claes L., "Prediction of Cortical Bone Porosity in Vitro by Microcomputed Tomography," Clcified Tissue Int., vol. 68, pp. 38-42, 2001. View Article
[35] Dowling N. E., "Mechanical Behavior of Materials," Engineering Methods for Deformation, Fracture, and Fatigue 2nd Ed.; Prentice Hall, New Jersey, pp. 286-337, 1999. View Book
[36] Pitzen T., Schmitz B., Georg T., Barbier D., Beuter T., Steudel W.I., Reith W., "Variation of Endplate Thickness in the Cervical Spine," European Spine J., vol. 13, pp. 235-240, 2004. View Article
[37] Edwards T.W., Zheng Y., Ferrara L.A., Yuan H.A., "Structural Feature and Thickness of the Vertebral Cortex in the Thoracolumbar Spine," Spine, vol. 15, pp. 218-225, 2001. View Article
[38] Hulme P.A. Boyd S.K., Ferguson S.J., "Regional Variation in Vertebral Bone Morphology and its Contribution to Vertebral Fracture Strength," Bone, vol. 41, pp. 946-957, 2007. View Article
[39] Panjabi M.M., Chen N.C., Shin E.K., Wang J.L., "The Cortical Shell Architecture of Human Cervical Vertebral Bodies," Spine, vol. 26, pp. 2748-2484, 2001. View Article
[40] Ladd A.J., Kinney J.H., Haupt D.L., Goldstein S.A., "Finite Element Modeling of Trabecular Bone: Comparison with Mechanical Testing and Determination of Tissue Modulus," J. of Orthopedic Res., vol. 16, pp. 622-628, 1998. View Article
[41] Niebur G.L., Feldstein M.J., Yuen J.C., Chen T.J., Keaveny T.M., "High Resolution Finite Element Models with Tissue Strength Asymmetry Accurately Predict Failure of Trabecular Bone," J. of Biomechanics, vol. 33, pp. 1575-1583, 2000. View Article
[42] Phillips C.A., "Human Factors Engineering," Jon Wiley & Sons, pp. 36, 2000. View Book
[43] S. Hueston, M. Makola, I. Mabe and T. Goswami, "Cervical Spine Anthropometric and Finite Element Biomechanical Analysis," Human Musculoskeletal Biomechanics, Dr. Tarun Goswami (Ed.), 2012. View Article
[44] Structured Data, "RiskAmp," New York.
[45] ASTM, "E399-90. Standard Test Method for Plane-Strain Fracture Toughness of Metallic Materials," 1997.
[46] Roy M.E., Rho J.Y., Tsui T.Y., Evans N.D., Pharr G.M., "Mechanical and Morphological Variation of the Human Lumbar Vertebral and Trabecular Bone," J. of Biomedical Materials Res. Part A, vol. 44, pp. 191-197, 1999. View Article
[47] Montgomery D. C. and Runger G. C., "Applied Statistics and Probability for Engineers," 4th Ed.; John Wiley & Son, New Jersey, pp 145-146. View Book