Journal of Biomedical Engineering and Biosciences (JBEB)
ISSN: 2564-4998

Volume 8 - Year 2021 - Pages 11-20
DOI: 10.11159/jbeb.2021.002
Rapidly Detected Common Wound Pathogens via Easy-to-Use Electrochemical Sensors
Aiden J. Hannah1, Andrew C. Ward2, Patricia Connolly1
1University of Strathclyde, Department of Biomedical Engineering
Technology & Innovation Centre, 99 George Street, Glasgow, G1 1RD
aiden.hannah@strath.ac.uk; patricia.connolly@strath.ac.uk
2University of Strathclyde, Department of Civil and Environmental Engineering
James Weir Building, Level 5, 75 Montrose Street, Glasgow, G1 1XJ 99
andrew.c.ward@strath.ac.uk
Abstract - The detection of infection in clinical practice is time consuming and laborious. The ability to monitor infection status in real time, for example in wounds, would enable earlier intervention and improved prognosis. This study describes the real time electrochemical detection of clinically important wound pathogens. Using impedance spectroscopy in conjunction with a normalisation approach, the growth of Proteus mirabilis in LB medium was detected 1 hour after sample inoculation at a cell concentration of 7.4 x10⁶ CFU/mL. Furthermore, a significant decrease in charge transfer resistance arose over the 24 hour growth period (p = 0.009), modelled using a simple equivalent circuit. Additional experiments performed in 0.9% w/v NaCl (where growth was inhibited) indicated that processes facilitated by this organism’s metabolism and growth dominated the impedance response in LB medium. Further, immediate detection of a high concentration of P. mirabilis cells was possible (5.0 x10⁸ CFU/mL). Finally, a simulated wound fluid was used to explore the growths of P. mirabilis, Pseudomonas aeruginosa and Staphylococcus aureus in a more complex environment representative of a wound bed. Similar changes to normalised impedance were observed, and decreases in normalised phase emerged as a characteristic indicator of bacterial growth. The ability of these low cost sensors to rapidly detect bacteria highlights their potential for adoption into point-of-care infection monitoring devices.
Keywords: Impedance spectroscopy; Infection; Rapid diagnostics; Screen printing; Bacterial detection.
© Copyright 2021 Authors This is an Open Access article published under the Creative Commons Attribution License terms. Unrestricted use, distribution, and reproduction in any medium are permitted, provided the original work is properly cited.
Date Received: 2021-08-20
Date Accepted: 2021-09-28
Date Published: 2021-10-06
1. Introduction and Related Work
Healthcare associated infections (HAI) are a significant threat to patient welfare, resulting in increased treatment times, costs and morbidity [1]. An estimated 7% of patients in European acute care hospitals are affected by HAI, with over one third of these patients prescribed antimicrobial treatment [2]. Due to the global rise in antimicrobial resistance, the development of rapid diagnostic techniques has been encouraged to help reduce antimicrobial usage and prolong the efficacy of existing drugs [3]. Furthermore, wound infections are a common form of HAI with a point prevalence survey of Scottish hospitals finding 16.5% of HAI to be surgical site infections and a further 2% to be infected decubitus ulcers [4]. In current clinical practice, gold-standard methods of wound infection detection and bacterial identification rely upon the observation of patient symptoms and selective culturing processes in a laboratory environment carried out by expert staff. With a typical turn-around time of around 48 hours, this method is not appropriate for fast diagnosis [5]. Recent advances in bacterial detection have seen the implementation of more rapid molecular testing technologies, these methods are often expensive, require laboratory infrastructure and highly qualified staff, and involve multiple sample processing steps [5]. This points to a strong need for cost-effective devices capable of real time wound infection monitoring.
Electrochemical impedance spectroscopy (EIS) has previously been used to detect microorganisms in a number of in-vitro studies and has the potential to be integral to an infection monitoring device [6]–[14]. By measuring complex impedance across a wide range of frequencies, EIS can be used to monitor changes at an electrode/electrolyte interface, yielding information about the biological properties of the sample. Label free detection with gold based electrodes in particular has been demonstrated for a range of pathogens including Escherichia coli, Pseudomonas aeruginosa and Staphylococcus epidermidis [6]–[9]. Screen printed electrodes have also been the subject of many studies due to their low cost and disposable nature lending them well to medical applications [10]–[12], [15].
From sampling a variety of infected wounds, Bessa et al. (2015) found the most frequent causative pathogen to be Staphylococcus aureus (present in 37% of wounds), followed by Pseudomonas aeruginosa (17%) and Proteus mirabilis (10%) [16]. These organisms form part of the body’s normal microflora for many healthy individuals, but can transition from commensal to invasive and pathogenic in compromised individuals [17]. This paper first focuses on the electrochemical detection of P. mirabilis, a Gram-negative bacterium commonly found in the human gastrointestinal tract. P. mirabilis is also a highly motile bacterium and demonstrates characteristic swarming behaviour. The ability to detect infections caused by this pathogen in real time is an important clinical problem. Whilst a range of bacteria have been detected using EIS, to the best of our knowledge this paper presents the first study of real-time P. mirabilis detection using a label-free, screen printed carbon electrode in conjunction with EIS. Additionally, the ability of the electrodes to detect all three of the most common wound pathogens in a simulated wound fluid was demonstrated. Overall, this study highlights the applicability of this technology to a possible future real-time wound infection sensing device.
2. Materials and Methods
2.1. Bacterial Strains and Media
Proteus mirabilis strain DSM 4479 (NCTC 11938), Pseudomonas aeruginosa strain PA14 and Staphylococcus aureus strain NCTC 8325 were used throughout the study. LB medium was made with 10 g tryptone (Fisher Scientific), 5 g NaCl (Fisher Scientific) and 5 g yeast extract (Acros Organics) in 1 L dH2O, autoclaved for 20 minutes at 121 ˚C. Stock cultures were obtained by inoculating 10 mL of sterile LB medium and incubating overnight at 37 ˚C, 150 rpm.
Washed P. mirabilis cells in 0.9% w/v NaCl were prepared as described in [12]. Briefly, this involved centrifuging an overnight culture of P. mirabilis, followed by removal of the supernatant and re-suspending the cells in 0.9% w/v NaCl. This procedure was repeated twice. The drop plate method of colony counting was used to enumerate the bacterial concentration of cells within samples [18].
Simulated wound fluid (SWF) was prepared by mixing 50% v/v of heat-inactivated Foetal Bovine Serum (Biosera) with Solution A. Solution A is a physiological salt solution prepared from 142 mM NaCl, 2.5 mM CaCl2.2H2O in dH2O and autoclaved for 20 minutes at 121˚C. The SWF is similar to wound exudate in terms of protein content, ionic content and viscosity, therefore providing a representative model of the wound environment [19].
2.2. Electrode Screen Printing and Conditioning
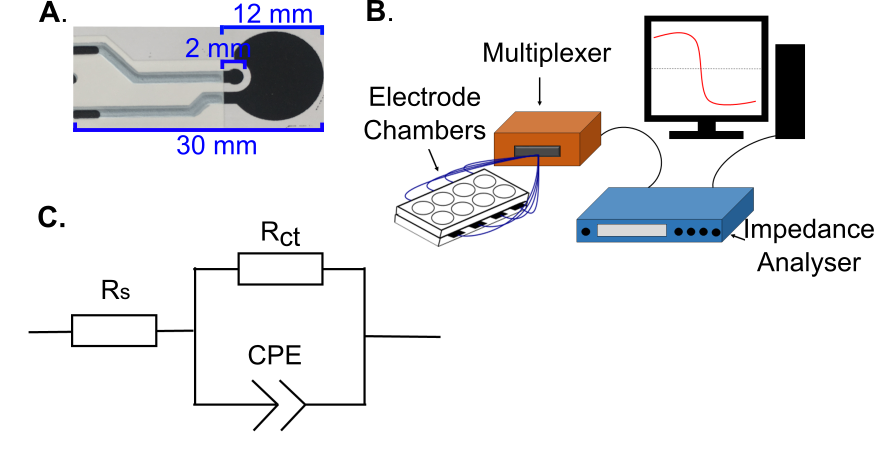
Disposable carbon electrodes were produced in-house for this study, identical to those described previously for studying S. aureus [12]. Two layers of solvent cure carbon ink (Henkel) were screen printed onto Polyethylene Terephthalate (PET) substrates (Hi-Fi Films), followed by a third layer of insulating dielectric ink (Gwent). Prior to printing the first layer and after printing each subsequent layer the electrodes were cured at 150 ˚C for 30 minutes in a fan assisted box oven. The resulting sensors were in a two-electrode configuration, with dimensions as shown in Figure 1A. Electrodes were secured between laser-cut acrylic plates using silicon adhesive sealant (Servisol). This gave arrays of 8 electrodes, with one electrode at the bottom of each self-contained well. Sensors were washed thoroughly in dH2O before conditioning in 0.9% w/v NaCl by applying a +2 V (vs OCP) potential for 3 minutes followed by -2 V for a further 3 minutes. This process improved the baseline sensor characteristics and consistency [12]. Electrode chamber sterilisation was then achieved using 70% v/v ethanol in dH2O.
2.3. Impedance Measurements
2.3.1. Investigation of P. mirabilis Detection
To study the impedance changes occurring due to P. mirabilis growth, following sterilisation the chambers were first filled with 750 µL of LB medium each and left to settle for at least 17 hours at 37 ˚C. Chamber contents were then replaced with 750 μL of fresh, sterile LB medium and half of them inoculated with 7.5 μL stock culture. A Solartron SI1260 instrument was used to perform impedance measurements (sweeps) between 1 MHz and 0.1 Hz, applying a sinusoidal perturbation voltage of 200 mV rms. Data is reported in the 1 Hz – 100 kHz range as this region contained the changes of interest. All measurements were carried out at 37 ˚C in a humid environment. A custom made Arduino-based multiplexer system was used to enable automated measurements of multiple electrode chambers in sequence (Figure 1B). For each chamber, an impedance sweep was conducted every 30 minutes for 6 hours, and then every 2 hours up to 24 hours.
For the next stage of this study washed cells were obtained as described in Section 2.1 and, after initial sensor incubation in sterile 0.9% w/v NaCl and a sterile impedance sweep, 750 µL of these stock solutions were placed directly onto each sensor. This resulted in a high cell concentration in each chamber without a carbon source to support growth. By adopting this strategy, it was possible to study interfacial changes induced by the cells themselves. Impedance measurements were again performed at the defined intervals over 24 hours
2.3.2. Detection of Bacteria in Simulated Wound Fluid (SWF)
For the final stage of the study, the process detailed in Section 2.3.1. was repeated separately for P. mirabilis, S. aureus and P. aeruginosa with SWF used to fill the chambers instead of LB medium. In this instance the negative control chambers were inoculated with 7.5 µL of sterile LB medium. This was done because the bacterial chambers were inoculated with 7.5 µL of bacterial culture grown in LB medium. Again, multiple automated EIS measurements were performed over 24 hours. Data is reported in the 10 Hz – 100 kHz range for SWF experiments, due to this containing the impedance changes of interest.
2.4. Data Analysis
2.4.1. Equivalent Circuit Modelling
Experimental data was fitted to the simple equivalent circuit shown in Figure 1C. This was carried out using a Z-View (Scribner Associates) instant fit function. For each sensor, the first and final measurement points (0 hours and 24 hours respectively) were fitted and circuit element values recorded. The percentage changes for these values were obtained using the following relation:

Where X24 and X0 are the sensor’s circuit element values at 24 hours and 0 hours respectively. Averaging was then performed for each sensor condition and statistical testing carried out (2 sample t-test, α = 0.05). By comparing starting values to those obtained at the end of the experiment, the full extent of the shift could be visualised.
2.4.2. Impedance Spectra Normalisation
Normalisation of the impedance spectra was conducted in line with a patented approach for cell and bacteria recognition (from electrical spectra) developed by the Strathclyde University Medical Diagnostics and Wearables research group [20]:
Where IPt=n is the impedance parameter being normalised and IPt=0 is the starting (“0 hour”) impedance parameter value. Furthermore, statistical analysis (2 sample t-test, α = 0.05) was carried out to determine the significance of any changes observed over time.
3. Results and Discussion
3.1. Real Time Growth Measurements of P. mirabilis in LB Medium
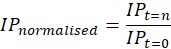
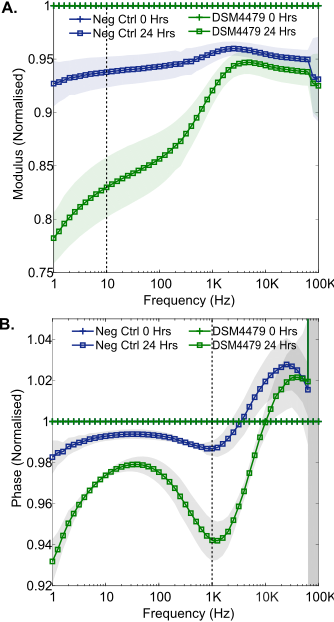
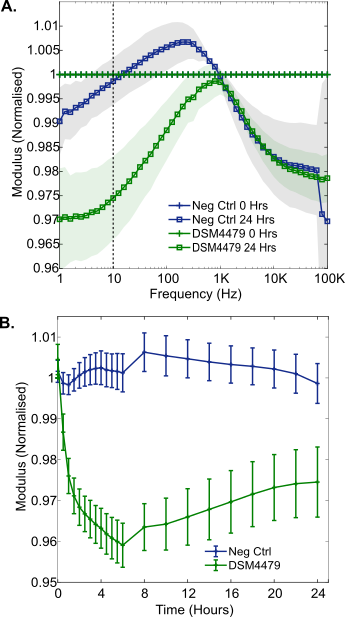
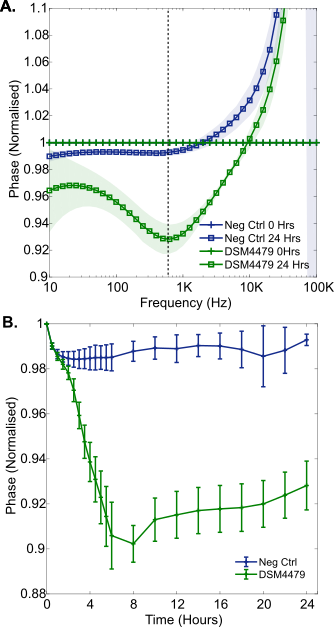
To investigate the electrochemical impedance changes induced by P. mirabilis growth, the bacteria were incubated in LB medium for 24 hours from approximately 7.4 x 10⁶ CFU/mL (range 6.6 x 10⁶ to 8.9 x 10⁶ CFU/mL, n = 4) to 4.6 x 10⁹ CFU/mL (range 3.7 x 10⁹ to 5.3 x 10⁹ CFU/mL, n = 4). In the normalised modulus and normalised phase spectra, decreases in magnitude were seen across the low and mid frequency regions (Figure 2A, 2B). These changes were found to be significantly different from the negative controls after 1 hour of bacterial growth (Figure 3A, 3B), and similar to those previously seen during S. aureus growth in LB medium [12]. These changes could be caused by a number of parallel processes which take place during cellular growth. Media conductivity is altered as the organism breaks down large macromolecules to produce waste products, by-products and secondary metabolites [21], [22]. The chemical properties of these molecules could thus contribute to the observed changes in the impedance through irreversible adsorption to the electrode surface combined with changes in the conductivity of the growth medium [10], [21]. Low frequency impedance changes have previously been attributed to Staphylococcus epidermidis growth for example, with metabolic activity believed to influence resistance and biofilm formation linked to capacitive changes [7]. It is likely that these processes are also underway in the results observed here.
3.2. Washed P. mirabilis Cell Measurements in 0.9% w/v NaCl
For experiments conducted in 0.9% w/v NaCl, washed P. mirabilis cells (5.0 x10⁸ CFU/mL, range 4.3 x10⁸ to 5.9 x10⁸ CFU/mL, n = 4) were added to the electrode chambers. Growth was inhibited during the 24 hour incubation period due to the lack of a carbon source. This was verified by colony counting, which showed a final concentration (similar to the starting inoculum) of 3.0 x10⁸ CFU/mL (range 2.7 x10⁸ to 3.3 x10⁸ CFU/mL). This experiment provides insight into the impedance response induced only by cells in isolation over time, and allows contrasts to be made to the response induced by metabolic processes occurring in LB medium.
The results show changes in the magnitude of the normalised impedance which were smaller than those observed in LB medium, where active growth of P. mirabilis was possible (Figure 4A). This is well illustrated at 10 Hz, where a maximum change of around 0.04 normalised units occurred for normalised modulus measurements in 0.9% w/v NaCl, in contrast to LB medium where the change was around 0.22 normalised units. This supports the idea that P. mirabilis cell behaviour promoted by the metabolism of nutrients dominated the larger impedance response seen in LB medium. Despite the smaller magnitude of these changes, the results were statistically significant immediately after inoculation of the electrodes with P. mirabilis, observed as a normalised resistance peak at 30 Hz (n = 4, p = 0.012). Furthermore, it was apparent that cellular settlement and adsorption to the carbon surfaces occurred over time. A progressively increasing change as a function of time was seen in the normalised impedance modulus, despite a lack of cell growth. This became significantly different to the negative control 30 minutes after inoculation and reached a minimum after 6 hours (Figure 4B). This could be caused by P. mirabilis cells adhering to the carbon electrode surface over a period of 6 hours. Bacterial attachment to surfaces is known to occur in two phases called reversible and irreversible. Initial reversible attachment is affected by the buoyant density and motility of bacteria, whereas electrostatic interactions govern later irreversible attachment over several hours [23]. In this study, the high motility of P. mirabilis potentially influenced the adsorption time. Cellular adhesion has been observed in a number of other studies demonstrating evidence for a link between impedance and direct cellular interactions with an electrode surface [9], [13], [14].
3.3. Equivalent Circuit Fitting of LB and Saline Results
Equivalent circuit fitting analysis performed on the P. mirabilis LB growth measurements (using the circuit shown in Figure 1C) revealed that a significant reduction in charge transfer resistance had occurred for the bacterial chambers (average change -91% ± 3.5% (n = 4) vs a negative control average change of -45.9% ± 6.6% (n = 3), p = 0.009). In contrast, no significant change in Rct or any other circuit element was seen in 0.9% w/v NaCl. This supports the hypothesis that these impedance changes (and thus changes to charge transfer resistance) were driven by growth related metabolic processes and not cell-electrode interactions such as adsorption. Evaluations of circuit parameter percentage changes have similarly been made in other studies, with changes in a variety of parameters such as double layer capacitance linked to the presence of bacteria [6], [13]. In some studies, a decrease in charge transfer resistance has also been found to closely relate to the growth of microorganisms on carbon-based electrode surfaces [24], [25]. The choice of electrode material is therefore likely to be influential in this particular change
3.4. Wound Pathogen Detection in SWF
3.4.1. Proteus mirabilis
The growths of common wound pathogens in SWF were measured to explore the potential of the printed electrodes and normalisation approach for the detection of wound infection in situ. Firstly, P. mirabilis (DSM 4479) was grown over a 24 hour period from an average starting concentration of 6.3 x10⁶ CFU/mL (range 5.9 x10⁶ CFU/mL to 6.8 x10⁶ CFU/mL, n = 4). Normalised impedance signatures emerged during this time: the normalised phase plot is shown in Figure 5A. A reduction in normalised phase emerged in the mid-frequency range, with a minimum at approximately 600 Hz (Figure 5A). After 5 hours of growth in SWF, the magnitude of the normalised phase at 600 Hz stabilised and remained similar until the 24 hour time point at the end of the experiment (Figure 5B). This may indicate a phase change saturation point, due to electrode coverage for example. Furthermore, this mid frequency normalised phase decrease has been shown to be present after both P. mirabilis growth in LB medium (Figure 2) and in SWF (Figure 5). It may therefore serve as a reliable identifier of the development of wound infection in situ. In theory, the time required to detect the onset of a P. mirabilis wound infection at similar bacterial concentrations with this sensor would be 2.5 hours, since statistically significant impedance changes emerged at this point during growth in the SWF (p = 0.007).
This result shows the importance of developing accurate models of the wound environment and future testing of clinical samples, as slight differences in trough frequency and also time to statistical significance have been observed between different growth media for P. mirabilis here (Figure 2B and Figure 5A).
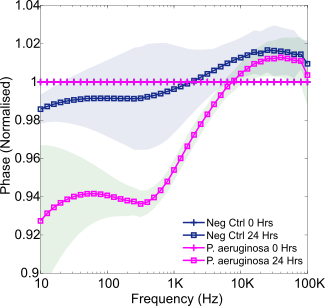
3.4.2. Pseudomonas aeruginosa
P. aeruginosa growth in SWF over 24 hours was next studied, from an average starting concentration of 9.3 x10⁶ CFU/mL (range 4.4-13 x106 CFU/mL). The resulting normalised phase plot is provided in Figure 6. Once more a mid-frequency decrease occurred which was of a similar magnitude to that observed during P. mirabilis growth. This may, therefore, indicate a phase change saturation point, due to electrode coverage for example. Whilst some lower frequency normalised phase differences are evident between this signature and the P. mirabilis signature, this is a region of high noise. Diffusion processes and system limitations result in the low frequency region being a common area of electrochemical noise. In addition, the impedance of the electrode itself contributes most at low frequencies, therefore, this effect may also be due to moisture settling on the electrode connectors over time in the incubator for example [26]. Nevertheless, repetition of these experiments in future could reveal if this is a change specific to P. aeruginosa, for example as a result of production of the electroactive metabolite pyocyanin [10]. Furthermore, statistically significant changes to normalised phase at 630 Hz resulted in P. aeruginosa detection after 2 hours of growth in SWF (p = 0.017).
3.4.3. Staphylococcus aureus
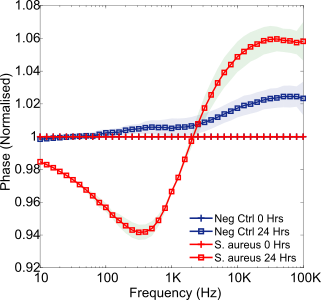
The final pathogen studied in SWF was S. aureus. Found to be the most common cause of wound infection, this particular bacterium is of critical clinical importance [16]. Growing over 24 hours from an initial cell density of 3.0 x10⁶ CFU/mL (range 1.8-4.5 x10⁶ CFU/mL), the resulting normalised phase spectrum is presented within Figure 7. Again, a mid-frequency trough emerged (with statistical significance starting between 2 – 5 hours, p = 0.001, normalised phase at 630 Hz). This feature appears, therefore, to be a reliable indicator of bacterial presence for each of these three common wound pathogens. For this particular species an additional high frequency normalised phase peak emerged. A similar peak was observed previously by Ward et al. (2018) [12] when studying the detection of S. aureus, attributing this feature to a high concentration of cells settled on the sensor surface. This may be a key differentiator between S. aureus and the other species studied, however, caution must be exercised as high frequency noise was present at these frequencies in the P. mirabilis experiment. High frequency EIS noise such as this is commonly believed to derive from instrumentation limitations, including the negative influence of cables [27].
Furthermore, each of these common wound pathogens could be rapidly detected in a simulated wound fluid via characteristic changes to normalised impedance. It is anticipated that the additional presence of multiple wound pathogens may influence the specific impedance variations seen, however, previous polymicrobial testing has suggested that a dominant pathogen and therefore response can emerge [10]. Previously Sheybani and Shukla (2017) [28] developed a dual sensor for detecting wound infection incorporating both pH and cell-attachment sensors, which successfully sensed the presence of various pathogens. Their study similarly reported mid-frequency changes in impedance due to the presence of bacteria, and attributed these to variations in double layer capacitance. The gold electrodes used were coated in functional polymeric layers and therefore required a more complex fabrication process than the simple screen-printed carbon sensors used in this study.
4. Conclusion
This study demonstrates the ability of label-free, screen printed carbon sensors to rapidly detect common wound pathogens. For the first time, through normalised impedance measurements, the growth of P. mirabilis was detected using disposable screen-printed carbon sensors. Whilst cellular adsorption to the electrode surface was detected, the dominant impedance changes were found to arise during active P. mirabilis cell metabolism and, therefore, were not solely due to direct cell contact with the electrode. Moreover, the growth of P. mirabilis was detected in a simulated wound fluid. This confirmed the accuracy of the observed characteristic impedance changes for detecting P. mirabilis, and the potential for this technology to be incorporated into a real time wound monitoring device that is able to rapidly detect infection. The additional detection of P. aeruginosa and S. aureus (two further common wound pathogens) in SWF via similar normalised impedance changes further confirmed the broad applicability of this technology to rapid infection diagnostics. The development of such a device could greatly reduce wound infection detection and identification times in clinical settings, promoting antimicrobial stewardship.
Acknowledgements
This research was funded by the EPSRC Centre for Doctoral Training in Medical Devices and Health Technologies (grant no. EP/LO15595/1). The development of medical sensors from this approach is licensed by the University of Strathclyde to Ohmedics Ltd.
The P. mirabilis results detailed in this paper were presented at ICBES’21 (www.international-aset.com).
References
[1] J. K. Schmier, C. K. Hulme-Lowe, S. Semenova, J. A. Klenk, P. C. DeLeo, R. Sedlak and P. A. Carlson, “Estimated hospital costs associated with preventable health care-associated infections if health care antiseptic products were unavailable.,” ClinicoEconomics and Outcomes Research, vol. 8, pp. 197–205, 2016. View Article
[2] P. Zarb , B. Coignard, J. Griskeviciene, A. Muller, V. Vankerckhoven, K. Weist, M. M. Goossens, S. Vaerenberg, S. Hopkins, B. Catry, D. L. Monnet, H. Goossens and C. Suetens, “The European Centre for Disease Prevention and Control (ECDC) pilot point prevalence survey of healthcare-associated infections and antimicrobial use,” Eurosurveillance, vol. 17, no. 46, p. 20316, Nov. 2012. View Article
[3] J. O ’Neill, “Tackling Drug-Resistant Infections Globally: Final Report and Recommendations the Review on Antimicrobial Resistance,” no. May, 2016.
[4] Health Protection Scotland, “National Point Prevalence Survey of Healthcare Associated Infection and Antimicrobial Prescribing 2016,” 2017.
[5] L. Bissonnette and M. G. Bergeron, “POC tests in microbial diagnostics: Current status,” in Methods in Microbiology, vol. 42, 2015, pp. 87–110. View Article
[6] X. Muñoz-Berbel, F. J. Muñoz, N. Vigués, and J. Mas, “On-chip impedance measurements to monitor biofilm formation in the drinking water distribution network,” Sensors Actuators B: Chemical, vol. 118, no. 1–2, pp. 129–134, Oct. 2006. View Article
[7] J. Paredes, S. Becerro, and S. Arana, “Label-free interdigitated microelectrode based biosensors for bacterial biofilm growth monitoring using Petri dishes,” Journal of Microbiological Methods, vol. 100, no. 1, pp. 77–83, May 2014. View Article
[8] L. Pires, K. Sachsenheimer, T. Kleintschek, A. Waldbaur, T. Schwartz, and B. E. Rapp, “Online monitoring of biofilm growth and activity using a combined multi-channel impedimetric and amperometric sensor,” Biosensors and Bioelectronics, vol. 47, pp. 157–163, Sep. 2013. View Article
[9] K. Settu, C. J. Chen, J. T. Liu, C. L. Chen, and J. Z. Tsai, “Impedimetric method for measuring ultra-low E. coli concentrations in human urine,” Biosensors and Bioelectronics, vol. 66, pp. 244–250, Apr. 2015. View Article
[10] A. C. Ward, P. Connolly, and N. P. Tucker, “Pseudomonas aeruginosa can be detected in a polymicrobial competition model using impedance spectroscopy with a novel biosensor,” PLoS One, vol. 9, no. 3, p. e91732, Mar. 2014. View Article
[11] R. Wang, J. Lum, Z. Callaway, J. Lin, W. Bottje, and Y. Li, “A label-free impedance immunosensor using screen-printed interdigitated electrodes and magnetic nanobeads for the detection of E. coli O157:H7,” Biosensors, vol. 5, no. 4, pp. 791–803, Dec. 2015. View Article
[12] A. C. Ward, A. J. Hannah, S. L. Kendrick, N. P. Tucker, G. MacGregor, and P. Connolly, “Identification and characterisation of Staphylococcus aureus on low cost screen printed carbon electrodes using impedance spectroscopy,” Biosensors and Bioelectronics, vol. 110, pp. 65–70, 2018. View Article
[13] T. Kim, J. Kang, J.-H. Lee, and J. Yoon, “Influence of attached bacteria and biofilm on double-layer capacitance during biofilm monitoring by electrochemical impedance spectroscopy,” Water Research, vol. 45, no. 15, pp. 4615–4622, Oct. 2011. View Article
[14] S. Bayoudh, A. Othmane, L. Ponsonnet, and H. Ben Ouada, “Electrical detection and characterization of bacterial adhesion using electrochemical impedance spectroscopy-based flow chamber,” Colloids and Surfaces A: Physicochemical and Engineering, vol. 318, no. 1–3, pp. 291–300, Apr. 2008. View Article
[15] D. Bruen, C. Delaney, L. Florea, and D. Diamond, “Glucose Sensing for Diabetes Monitoring: Recent Developments,” Sensors, vol. 17, no. 8, p. 1866, Aug. 2017. View Article
[16] L. J. Bessa, P. Fazii, M. Di Giulio, and L. Cellini, “Bacterial isolates from infected wounds and their antibiotic susceptibility pattern: some remarks about wound infection,” International Wound Journal, vol. 12, no. 1, pp. 47–52, Feb. 2015. View Article
[17] A. L. Cogen, V. Nizet, and R. L. Gallo, “Skin microbiota: a source of disease or defence?,” British Journal of Dermatology, vol. 158, no. 3, pp. 442–55, Mar. 2008. View Article
[18] B. Herigstad, M. Hamilton, and J. Heersink, “How to optimize the drop plate method for enumerating bacteria,” Journal of Microbiological Methods, vol. 44, no. 2, pp. 121–129, 2001. View Article
[19] S. D. Milne and P. Connolly, “The influence of different dressings on the pH of the wound environment,” Journal of Wound Care, vol. 23, no. 2, pp. 53–57, 2014. View Article
[20] P. Connolly and L. Shedden, “A system and method for cell characterisation,” 07-May-2010, WO2009136157.
[21] U. Schröder, F. Harnisch, and L. T. Angenent, “Microbial electrochemistry and technology: terminology and classification,” Energy and Environment Science, vol. 8, no. 2, pp. 513–519, 2015. View Article
[22] A. Ur and D. F. J. Brown, “Impedance Monitoring of Bacterial Activity,” Journal of Medical Microbiology, vol. 8, no. 1, pp. 19–28, Feb. 1975. View Article
[23] H. H. Tuson and D. B. Weibel, “Bacteria-surface interactions.,” Soft Matter, vol. 9, no. 18, pp. 4368–4380, May 2013. View Article
[24] R. P. Ramasamy, Z. Ren, M. M. Mench, and J. M. Regan, “Impact of initial biofilm growth on the anode impedance of microbial fuel cells,” Biotechnology and Bioengineering, vol. 101, no. 1, pp. 101–108, Sep. 2008. View Article
[25] Z. Ren, R. P. Ramasamy, S. R. Cloud-Owen, H. Yan, M. M. Mench, and J. M. Regan, “Time-course correlation of biofilm properties and electrochemical performance in single-chamber microbial fuel cells,” Bioresource Technology, vol. 102, no. 1, pp. 416–421, Jan. 2011. View Article
[26] P. R. F. Rocha, P. Schlett, U. Kintzel, V. Mailänder, L. K. J. Vandamme, G. Zeck, H. L. Gomes, F. Biscarini, D. M. De Leeuw, “Electrochemical noise and impedance of Au electrode/electrolyte interfaces enabling extracellular detection of glioma cell populations,” Scientific Reports, vol. 6, Oct. 2016. View Article
[27] C. You, M. A. Zabara, M. Orazem, and B. Ulgut, “Application of the Kramers-Kronig Relations to Multi-Sine Electrochemical Impedance Measurements,” Journal of the Electrochemical Society, vol. 167, no. 020515, 2020. View Article
[28] R. Sheybani and A. Shukla, “Highly sensitive label-free dual sensor array for rapid detection of wound bacteria,” Biosensors and Bioelectronics, vol. 92, pp. 425–433, Jun. 2017. View Article