Journal of Biomedical Engineering and Biosciences (JBEB)
ISSN: 2564-4998

Volume 8 - Year 2021 - Pages 1-10
DOI: 10.11159/jbeb.2021.001
Development of High Sensitive and Quantitative FRET Based Biosensor to Detect Atg4A Kinetics in Autophagy Cell Death Pathway
Chitra Hariharan1, Fatma Zehra Kadayifci2, Fan Zhang3, Lei Xu4, Jun Li5*, Shasha Zheng2*, Jiayu Liao1*
1Department of Bioengineering, 5Department of Statistics, University of California
900 University Avenue, Riverside, CA 92521,
2Department of Nutritional Science, California Baptist University,
8432 Magnolia Ave, Riverside, CA 92504
3Department of Healthcare Management, West China Hospital, Sichuan University,
Chengdu 610041, China
4Department of Geography & the Environment, California State University,
Fullerton, CA 92831
*Corresponding authors
Abstract - Cell death is a major process in a biological cell that occurs during development, homeostasis and immune regulation in multicellular organisms. Dysregulation of cell death pathway has been implicated in many diseases. Principal cell death pathways include apoptosis, autophagy, necrosis, mitotic catastrophe, etc. Knowledge of cell death pathways and the reason the cell chooses to die are key factors to understand the disease, the way it affects the cellular system and subsequent drug discovery. This study is focused on developing genetically encoded Förster Resonance Energy Transfer (FRET) based biosensors to identify autophagy pathways in vitro. FRET is an energy transfer phenomenon that occurs between two spectrum-overlapping fluorophores that are within 10nm of each other. The design of the sensor is based on enzyme-substrate dynamics and consists of a reporter gene fused between fluorescent proteins. Additionally, FRET-based protease assay has been used to determine the kinetics of Atg4A, an enzyme involved in autophagy. The kinetic parameters Km, kcat, kcat /Km were derived using real-time detection methods. A further aim of this research is to transfect the sensor in H460 lung cancer cell line to identify the type of death that the cell chooses on treatment with drugs.
Keywords: quantitaive FRET(qFRET), Autophagy, Cell Death, Atg4 kinetics, protease natural substrate
© Copyright 2021 Authors This is an Open Access article published under the Creative Commons Attribution License terms. Unrestricted use, distribution, and reproduction in any medium are permitted, provided the original work is properly cited.
Date Received: 2020-05-02
Date Accepted: 2020-09-08
Date Published: 2021-03-17
1. Introduction
The major cell death pathways, classified as autophagic, apoptotic, and necrotic, work to maintain homeostasis in the organism. Dysregulation of these pathways leads to several pathologies. Identification of the pathway the cells takes to die has important therapeutic implications. At the same time, there is a need for a specific and sensitive technology to identify and modulate the pathway [1]-[4].
Autophagy is an intracellular degradation process that helps in cell survival by removing unnecessary components, damaged organelles, misfolded proteins and specific intracellular pathogens by the lysosomal degradation process. Additionally, autophagy plays an important role in cellular dysfunction and cell death under certain circumstances. Studies suggest that the autophagy process, in both cell survival and cell death, can be a significant therapeutic target for neurodegenerative diseases and cancer [5-10].
The process of Autophagy is initiated and executed by the Autophagy-related genes (Atg) family that was discovered by genetic screening in yeast. Two ubiquitin-like conjugation systems are key to autophagy: the Atg5-Atg12 and the Atg8-phosphatidylethanolamine systems. In mammals, there are six Atg8 homologues namely LC3A, LC3B, LC3C, GABARAP, GATE16/GABARAPL2 and GABARAPL1 (Atg8L) and four Atg4 homologues namely Atg4A, Atg4B, Atg4C, Atg4D. Atg4 is a cysteine protease that cleaves Atg8 at the carboxyl terminus to expose the glycine residue that is necessary for subsequent reactions. This is a crucial step in the autophagosome biogenesis and presents itself as a target for therapeutic interventions [11-13].
Standard methods to detect autophagy such as fluorescence microscopy techniques, although reliable, suffer from a need of expensive reagents, trained personnel, as well as being laborious and unsuitable for quantitative analysis or high throughput applications[14-15]. Fluorescent biosensors are among a highly diverse class of biosensors that exploit the intrinsic property of a biomolecule to modulate the fluorescent intensity or hue of a pair of fluorophores. Biosensors have the advantage of high sensitivity, versatility, and simplicity [16-18]. In our research, we have introduced genetically encoded biosensors that work on the principle of FRET.
Förster Resonance Transfer Energy (FRET) has been widely used in biological studies both in vitro and in vivo for static and real-time measurements. It relies on the transfer of energy from an excited donor fluorophore to an acceptor fluorophore non-radiatively. For efficient and accurate FRET, the two fluorophores must be in a favorable orientation and within proximity of about 10 nm. FRET-based biosensors have a wide range of applications that range from monitoring heterogeneous cell populations to studying a single cell in real time[16, 19].
FRET-based assays have been used to study protein-protein interactions, ligand-receptor binding as well as the activity of enzymes [20-26]. We have exploited the use of this technology to study protease activity. Understanding the dynamics of Atg4A is key to gain an in-depth knowledge of the autophagy pathway. The catalytic efficiency or specificity of an enzyme is best characterized by the ratio of the kinetic constants, kcat/ Km. It indicates the efficiency with which the enzyme catalyzes a reaction both in the forward and reverse directions. The accuracy of proteases kinetic parameters is not only important for understanding protease activity in normal physiological processes but also critical for estimating inhibitor potency and efficacy for drug discovery and development.
Previous methods to characterize Atg4A enzyme efficiency parameters have been attempted on substrate Gate16-GST by using SDS-PAGE technique along with Coomassie Blue staining. The amounts of substrates, as well as cleaved products, were quantified by densitometry and the use of GST standard curve. The kcat/Km obtained using this method was 1*104 M-1s-1. Assessment of Atg4 activity has been mainly based on an SDS-PAGE-based assay, which can be cumbersome and highly variable with relatively low detection sensitivity. These methods would only be suitable for in vitro analysis and cannot be formatted for high-throughput analysis. FRET-based kinetic analysis has also been studied on full-length Gate16 using parental CFP-YFP. The value of kcat/Km obtained using this method was 1310 M-1s-1 which was even lower than that obtained when GATE16-GST was used [5, 27].
Here, we describe the development of a highly sensitive FRET-based Biosensor to study the autophagy pathway. An engineered FRET pair, CyPet and YPet, with significantly improved FRET efficiency and fluorescence quantum yield[28] compared to the parental CFP-YFP was used to generate the CyPet-Gate16-YPet substrate. Additionally, assays were designed to study the kinetics of Atg4A. This method includes the application of quantitative FRET analysis together with the considerations of the self-fluorescence of donor and acceptor during the digestion analysis of Gate16. The absolute fluorescent signals were converted into protein concentrations using the real-time detection method. The value of kcat/Km of Atg4A toward Gate16 was obtained as 5.2x10⁴ M-1s-1, which agrees with general enzymatic kinetic parameters. Besides, error propagation and analysis have been done using both GraphPad and R. This assay in future will be converted to a high throughput screening assay to screen for Atg4A inhibitors.
2. Material and Methods
2.1. Plasmid Constructs/Autophagy
The open reading frame of CyPet was amplified using primers containing the portion of pET28b vector sequence 3’ to NheI site and CyPet as a template; YPet was amplified using primers containing the reverse complement of the portion of PET28b that was 3’ to XhoI site and YPet as a template. The open reading frame of Gate16 was amplified using Gate16 as a template. The construct was designed to have three restriction enzyme sites XhoI, HindIII, SalI in the same order from the C-terminus of CyPet to the N-terminus of Gate16. Three more restriction sites BamHI, NheI and EcorI were added in the same order from C-terminus of Gate16 to the N-terminus of YPet. Multiple restriction sites were incorporated so that the construct could be put to good use in the future. PCR was performed to amplify fragments pET28b (overlap)-CyPet-XhoI-HindIII-SalI, Gate16-BamHI-NheI-EcorI and YPet. pET28b vector was digested with NheI and Xho1. The concentration of the PCR fragments along with the digested vector fragment was measured using Nanodrop. The fragments were incubated with 10ul NEB Master Mix in a 1:1 ratio for 1 hour at 50°C. The mixture was then transformed into TOP10 Escherichia cells and the colonies screened to get the positive clone. The construct was obtained after sequencing results were confirmed.
Similarly, for determining the donor self-fluorescence a, the fragment CyPet-XhoI-HindIII-SalI-Gate16 (cleaved) was cloned into pET28b vector and sequenced. The acceptor self-fluorescence b did not vary much between different proteins tagged to YPet. Hence, it was summarized from previous results23, 25.
2.2. Protein Expression and Purification
Escherichia coli cells of strain BL21 (DE3) were transformed with pET28 vectors encoding Atg4A, CyPet-XhoI-HindIII-SalI-Gate16-BamhI-NheI-EcorI-YPet and CyPet-XhoI-HindIII-SalI-Gate16 (cleaved). The transformed bacterial cells were plated onto LB agar plates containing 50 mg/ml kanamycin, and a single clone for each protein was picked up for starter culture and inoculated in 10 ml LB overnight at 37°C. This was transferred to 1L 2XYT medium and grown at 37°C for 3 hours until the optical density of the bacterial culture reached 0.5-0.6. Expression of polyhistidine-tagged recombinant proteins was induced with 0.3mM isopropyl b-D-1-thiogalactopyranoside at 25°C overnight. The 6x histidine-tagged recombinant proteins were purified from bacterial lysates with nickel agarose affinity chromatography (Qiagen, Valencia, CA, USA) and eluted in 20 mM Tris-HCl, pH 7.4, 50 mM NaCl, 1 mM DTT. Protein purity was examined by SDS-PAGE and concentrations of the purified proteins were determined by the Bradford assay (Thermo Fisher Scientific, Waltham, MA, USA). Similar purification protocol was followed to purify Atg4A protease (Addgene).
2.3. Fluorescence Spectrum Analysis of FRET
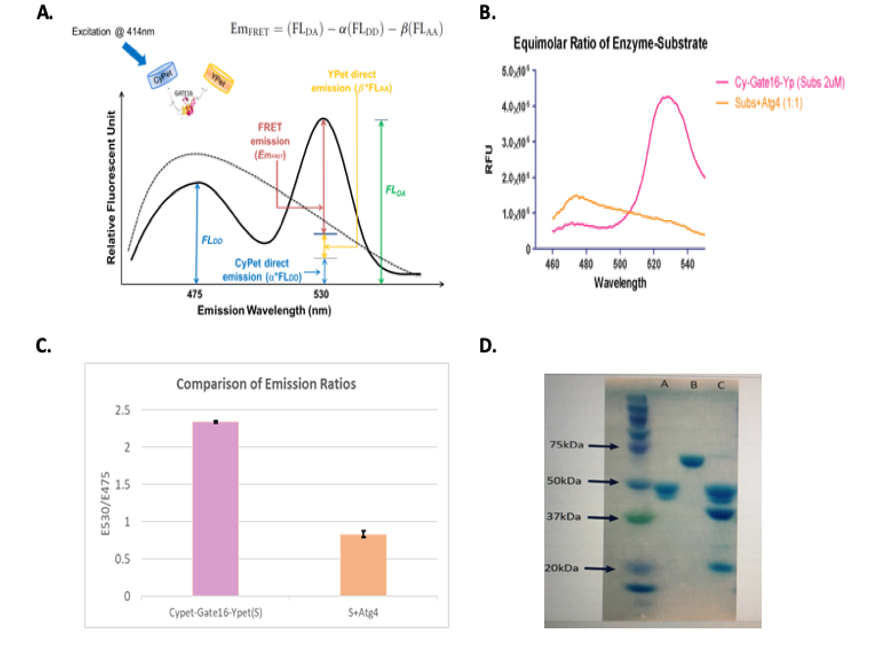
When substrate CyPet-Gate16-YPet is excited at 414 nm, the emission at 475 nm was from the emission of unquenched CyPet (FLDD). The emission intensity at 530 nm (FLDA) consists of three components: the direct emission of unquenched CyPet (FLDD), the direct emission of YPet (FLAA) and the emission of YPet excited by energy transferred from CyPet (EmFRET). Excited at 475 nm, an emission peak at 530 nm (FLAA) was observed from the direct excitation of YPet but not CyPet. The direct emission of donor, CyPet, at 530 nm was proportional to its emission at 475 nm when excited at 414 nm with a ratio factor of α, while the direct emission of acceptor, YPet, at 530 nm was proportional to its emission at 530 nm when excited at 475 nm with a ratio factor of β. Therefore, the FRET emission of YPet (EmFRET) can be determined by:

2.4. Standard Curve Analysis
CyPet-Gate16-YPet was incubated at 37°C in a suitable buffer (50mM Tris–HCl Ph 8, 150mM NaCl, 1mM DTT) to a total volume of 80 μl and added to each well of a 384-well plate. The emission signals at 475 nm were collected after excitation at 414 nm. The concentration was varied from 0.1 to 1 μM. CyPet-Gate16 (cleaved) and YPet were also incubated at 37°C in the same buffer to a total volume of 80 μl with 1:1 molar ratio and added to each well of a 384-well plate. The emission signals at 475 nm were collected after excitation at 414 nm. The concentration of CyPet-Gate16 was varied from 0.1 to 1 μM.
2.5. Determine Digested Substrate Concentration from the FRET Signal Changes
After digestion by Atg4A, the fluorescent signal at 530 nm decreased, and the fluorescent signal at 475 nm increased because of the disruption of the FRET signal after substrate digestion. The remaining fluorescent emission at 530 nm (Em’FRET) could still be divided into a similar three components

where FL’DA is the remaining FRET-induced acceptor emission, FL’DD is the fluorescent emission of CyPet, which consists of two parts: the undigested CyPet-Gate16-YPet and the digested CyPet-Gate16, and FL’AA is the fluorescent emission of YPet, which is constant whether the substrate is digested or not. The amount of digested substrate is correlated with the decrease of the absolute FRET signal. Therefore, after treatment with Atg4A, the remaining FRET-induced acceptor’s emission ![]()
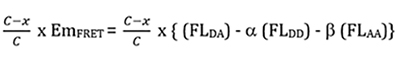
where C is the concentration of substrate(uM) and x is the concentration of digested substrate(uM).
2.6. Statistical analysis
The bootstrap method was implemented in R to calculate enzyme efficiency parameters and 95% confidence intervals for kcat/Km.
3. Results
3.1 Design of a highly sensitive Biosensor to detect Autophagy pathway using FRET and characterization of emission ratio
A FRET fusion substrate CyPet-Gate16-YPet with a strong fluorescent signal for Atg4A protease activity was constructed. Digestion by Atg4A releases the products CyPet-Gate16 (cleaved) and C-terminus of Gate16-YPet, and the FRET signal decreases corresponding to the amount of digested substrate (Figure 1).
CyPet-Gate16-YPet (2uM) was mixed with Atg4A in a 1:1 molar ratio along with a suitable buffer (50mM Tris–HCl pH 8, 150mM NaCl, 1mM DTT) to a total volume of 60ul and incubated for 60 min at 37°C. As a control, the substrate CyPet-Gate16-YPet was mixed with the same buffer to a total volume of 60ul and incubated at the same temperature for the same time. The mixture was transferred
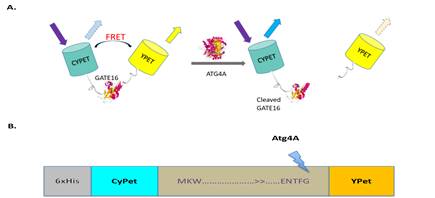
- The cartoon depicts the principle behind the sensor design. In the absence of Autophagy, a strong FRET signal can be observed. When Atg4A is added, it cleaves Gate16 at the Glycine Residue resulting in separation between CyPet and YPet and loss of FRET. B) shows the design of Autophagy full-length Biosensor. Gate-16 full-length sequence is sandwiched between fluorescent proteins CyPet and YPet. The construct is cloned into pET28b vector with an N-terminal Histidine tag. Atg4A cleaves Gate-16 at the C-terminus of glycine residue.
To a 384 well plate and readings were taken from Flexstation II (Molecular Devices Inc) by exciting at 414nm. The emission intensity is measured in Relative Fluorescence Units (RFU) and plotted on the y-axis. Wavelength measured in nm is plotted on the x-axis (Figure 2B). The emission ratio (E530/E475) changes more than 2fold when substrate CyPet-Gate16-YPet is incubated with enzyme Atg4A (100:1) ratio at 37˚C and excited at 414 nm (Figure 2C). Also shown are the results of SDS-Page gel obtained before and after digestion of the substrate (Figure 2D).
3.2. Donor self-fluorescence determination
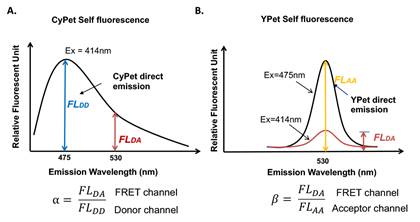
To determine the cross-talk ratio of CyPet’s self-fluorescence, purified CyPet-Xho1-HindIII-Sal1-Gate16 (cleaved) was incubated at 37°C in buffer containing 20 mM Tris-HCl, pH 7.4, 50 mM NaCl, 0.1% (v/v) Tween-20 and 1mM DTT to a total volume of 80 μL at concentrations of 20nM, 50nM, 100nM, 200nM, 500nM, 750nM and 1000nM for 10 minutes and added to each well of a 384-well plate (Greiner, glass-bottom). Fluorescent emissions of CyPet at 475 and 530 nm were detected in a fluorescence multi-well plate reader (Flexstation II384, Molecular Devices, Sunnyvale, CA, USA) when excited at 414 nm to determine the cross-talk ratio α. Three samples were repeated for each concentration. α value was determined to be 0.38+ 0.02. b was summarized from previously obtained results as 0.026 (Figure 3).
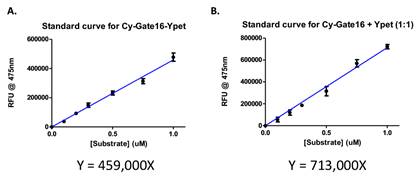
3.3. Standard curve
Standard curves were obtained to derive the relationship between the FRET signal and protein concentrations. The undigested substrate CyPet- Gate16-YPet was incubated in
A suitable buffer at 37˚C, and emission signals were obtained at 475nm after exciting at 414nm. Similarly, emission signals were obtained from the products obtained after digestion of the substrate. Slopes value was obtained as 459000 and 713000 respectively, describing the linear relationship between the detected fluorescent signals and the protein concentrations (Figure 4).
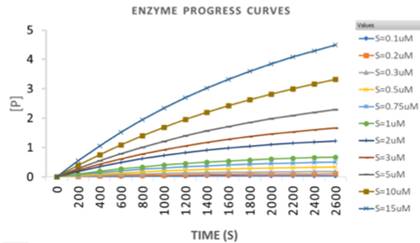
3.4. Atg4A protease kinetics assay
FRET-based kinetic assays were conducted by using the kinetic spectrum in a fluorescence multi-well plate reader (Flexstation II384, Molecular Devices) that was set to 37 ̊ C. Blank readings were taken after adding buffer (50mM Tris HCl Ph 8, 150mM NaCl and 1mM DTT) to a total volume of 80ul in the 384 well plate. This constitutes the background signal. The substrate CyPet-Gate16-YPet at different concentrations starting from 0.1uM, 0.2uM,
0.3uM, 0.5uM, 0.75uM, 1uM, 2uM, 3uM, 5uM, 10uM and 15uM was incubated in the buffer to a total volume of 80ul at 37°C and transferred to each well of a 384-well plate (Greiner, glass-bottom). Three samples were repeated for each concentration. Readings were taken every 52 secs for one hour. Atg4A was then added at a concentration of 10nM to the substrate using a multichannel pipette. Same readings were repeated. The data was imported into MS Excel. Background signal was subtracted from the original data, which was then processed to get EmFRET, Em’FRET and x (amount of digested substrate). The x values are imported into GraphPad in replicate. The curve fit is performed using nonlinear regression. The concentration of product formation increases exponentially with time from time t=0 when the substrate concentration is 0 to a concentration of S0 at a time 0 per the following formula:

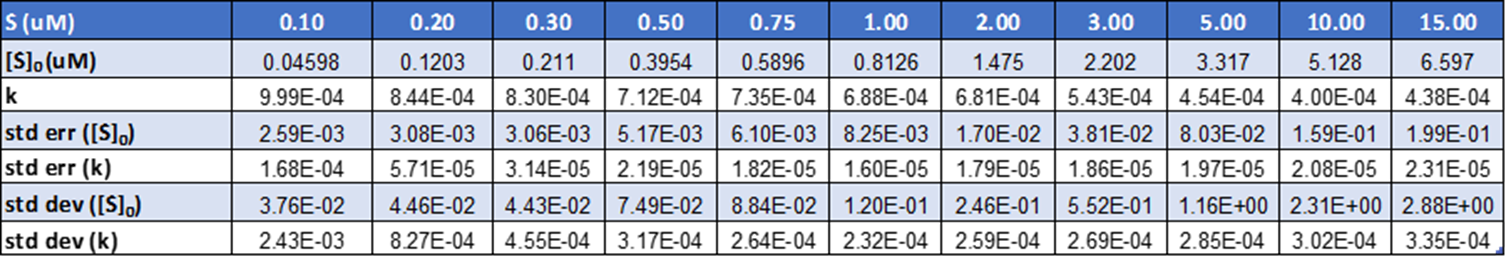
One phase association model with least-squares criteria was used to fit the data (Figure 5). GraphPad Prism provides the mean and standard error values of the key parameters of the model, namely the plateau 〖[S]〗_0 (the substrate concentration at a time 0) and k (the rate constant). The standard deviation of the parameters is calculated by taking the product of standard error and the square root of the no of points analysed for arriving at the result (Table1).
To determine the reaction velocity of Atg4A, the reaction rate (V) was correlated to the change in the amount of substrate (S):

Table 1. The mean values of rate constant (k) and substrate concentration at a time 0 (S0) are derived along with the standard error and standard deviation values.
The initial velocity of the reaction is determined by calculating the derivative of the product formed at time t=0. The values obtained are listed in (Table 2):
The standard error of V0 () is then computed using the formula:
3.5. Michaelis-Menten Model
The mean and the standard error of Vo are plotted against the substrate concentration in GraphPad Prism V software to fit the Michaelis–Menten equation (Figure 6).
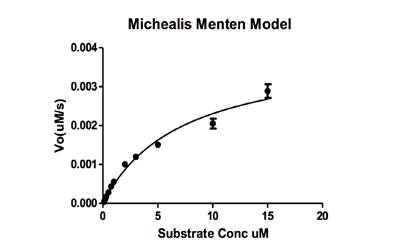
The value of kcat/Km is calculated using the below formula:
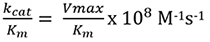
Table 2. The initial velocity values obtained along with the Standard error.
| S (uM) | V0 (uM/s) | Std error (V0) |
| S=0.1 | 4.59x10⁻⁵ | 8.13x10⁻⁶ |
| S=0.2 | 1.02x10⁻⁴ | 7.34x10⁻⁶ |
| S=0.3 | 1.75x10⁻⁴ | 7.10x10⁻⁶ |
| S=0.5 | 2.82x10⁻⁴ | 9.40x10⁻⁶ |
| S=0.75 | 4.33x10⁻⁴ | 1.17x10⁻⁵ |
| S=1 | 5.59x10⁻⁴ | 1.42x10⁻⁵ |
| S=2 | 1.00x10⁻³ | 2.88x10⁻⁵ |
| S=3 | 1.20x10⁻³ | 4.58x10⁻⁵ |
| S=5 | 1.51x10⁻³ | 7.48x10⁻⁵ |
| S=10 | 2.05x10⁻³ | 1.24x10⁻⁴ |
| S=15 | 2.89x10⁻³ | 1.76x10⁻⁴ |
The standard error of (kcat/Km) is calculated using the following equation:

95% confidence intervals were found using Microsoft Excel.
The derived values of Vmax, Km, kcat, and kcat/Km ratio are listed in the (Table 3).
Table 3. The kinetic parameters that demonstrate the enzyme efficiency of Atg4A.
| Vmax in uM/s | Km in uM | kcat/Km in M-1S-1 | 95% Cl |
| Vmax (mean) 3.96x10⁻³ | Km (mean) 7.19 | kcat/Km(mean) 5.51x10⁴ | 6.32x10⁴ |
| Vmax(Std error) 3.77x10⁻⁴ | Km(Std error) 1.42 | kcat/Km(Std error) 1.21x10⁴ | 4.70x10⁴ |
Error analysis was also done using the bootstrap method in R. The values of kcat/Km and 95% confidence intervals were shown in (Table 4).
5. Discussion
Here, we have reported the development of a highly sensitive FRET-based biosensor to detect autophagy pathway. The efficiency of the biosensor lies in the use of a highly optimized FRET pair CyPet-YPet and a robust
The initial velocity of differenct substrate concentrations digeted by Atg4A were determined by the FRET signal of substrate CyPet-Gate16-YPet digestion by Atg4A.
Construct design that can detect the execution phase of autophagy most efficiently. We have also described a quantitative FRET-based protease assay for determination of the kinetic parameters of Atg4A in the digestion of Gate16. The value of kcat/Km 5.5 X 10⁴ M−1 s−1 obtained through this method is higher than the values obtained previously in the literature. In this approach, the absolute FRET signal was correlated to the digested substrate and was continuously determined during the digestions of CyPet-Gate16-YPet by Atg4A. The experimental procedure used here obtains kinetic parameters by deriving the quantitative contributions of absolute fluorescence signals from a donor, acceptor, and real FRET at the acceptor’s emission wavelength. Traditional ratiometric measurements of FRET do not consider the direct emissions and convert all the signal change to disrupted energy transfer [5, 22, 26]. This results in an overestimation of kinetic parameters from the Michaelis-Menten equation because of an overestimation of FRET emission signal (containing donor and acceptor direct emission) and an overestimation of FRET donor emission (increases with the digested substrate).
Table 4. The kinetic parameters obtained using bootstrap method in R.
| kcat/Km (mean) (M-1LS-1) |
5.52 x10⁴ |
| 95% Cl | 5.86 x10⁴ |
| 5.18 x10⁴ |
Gate16's digestion by Atg4A has been studied by other methods, such as protein gel-based methods used on substrate Gate16-GST (Gate16 tagged with GST) and a ratiometric-based FRET assay that used FRET-Gate16 (Gate16 fused between CFP AND YFP) as a substrate. The former established a kcat/Km value of 12,800 M−1 s−1 while a value of 1,310 M−1 s−1 was obtained from the latter. Both the techniques used different methods to analyze enzyme efficiency parameters as well as the different configuration of substrates. This showed that specificity of Atg4A towards substrate depends on the configuration of substrates [5, 27]. Atg4A is unable to cleave the peptide sequence of GATE16 as efficiently as opposed to the full-length protein (results not shown). This implies the existence of dynamics between Atg4A and Gate16 that needs further investigation.
Determination of standard error and 95% confidence intervals of the enzyme efficiency parameters have been done using GraphPad as well as bootstrap technique in R. Although kcat/Km values obtained were similar using both methods, the confidence intervals have a tighter fit using the statistical bootstrap method.
Our assay has multiple advantages that include, 1. The FRET-based assay has higher sensitivity than a gel-based assay, 2. The assay is interference-free and involves an only enzyme (enzyme in free form or as a complex with substrate), substrate and the products, 3. The use of optimized FRET pair CyPet-YPet in the reaction results in an 11-fold signal change as opposed to 3-fold observed when the parental pair CFP-YFP is used. The use of CyPet-YPet promises improved sensitivity and dynamic range of detection.
6. Conclusion
In conclusion, the biosensor developed in this study is highly sensitive in detecting autophagy and can be used to derive quantitative data using FRET technology. It can be used both in vitro and in mammalian cells and can differentiate between cell death pathways. The results of this study can help to expand biomedical knowledge by illuminating the mechanisms of different cell death pathways. This will pave the way for simple and non-invasive ways to modulate cell death pathways for therapeutic intervention in the future. These results are significant, as many high throughput assays that will be based on the protease require a thorough knowledge of their biology. The search for small molecule drugs that target proteases has been a topic of intensive research throughout academics and industry.
References
[1] Elmore S. Apoptosis: a review of programmed cell death. Toxicol Pathol. 2007;35(4):495-516. doi: 10.1080/01926230701320337. PubMed PMID: 17562483; PMCID: PMC2117903. View Article
[2] Kroemer G, Galluzzi L, Vandenabeele P, Abrams J, Alnemri ES, Baehrecke EH, Blagosklonny MV, El-Deiry WS, Golstein P, Green DR, Hengartner M, Knight RA, Kumar S, Lipton SA, Malorni W, Nunez G, Peter ME, Tschopp J, Yuan J, Piacentini M, Zhivotovsky B, Melino G, Nomenclature Committee on Cell D. Classification of cell death: recommendations of the Nomenclature Committee on Cell Death 2009. Cell Death Differ. 2009;16(1):3-11. doi: 10.1038/cdd.2008.150. PubMed PMID: 18846107; PMCID: PMC2744427. View Article
[3] Galluzzi L, Aaronson SA, Abrams J, Alnemri ES, Andrews DW, Baehrecke EH, Bazan NG, Blagosklonny MV, Blomgren K, Borner C, Bredesen DE, Brenner C, Castedo M, Cidlowski JA, Ciechanover A, Cohen GM, De Laurenzi V, De Maria R, Deshmukh M, Dynlacht BD, El-Deiry WS, Flavell RA, Fulda S, Garrido C, Golstein P, Gougeon ML, Green DR, Gronemeyer H, Hajnoczky G, Hardwick JM, Hengartner MO, Ichijo H, Jaattela M, Kepp O, Kimchi A, Klionsky DJ, Knight RA, Kornbluth S, Kumar S, Levine B, Lipton SA, Lugli E, Madeo F, Malomi W, Marine JC, Martin SJ, Medema JP, Mehlen P, Melino G, Moll UM, Morselli E, Nagata S, Nicholson DW, Nicotera P, Nunez G, Oren M, Penninger J, Pervaiz S, Peter ME, Piacentini M, Prehn JH, Puthalakath H, Rabinovich GA, Rizzuto R, Rodrigues CM, Rubinsztein DC, Rudel T, Scorrano L, Simon HU, Steller H, Tschopp J, Tsujimoto Y, Vandenabeele P, Vitale I, Vousden KH, Youle RJ, Yuan J, Zhivotovsky B, Kroemer G. Guidelines for the use and interpretation of assays for monitoring cell death in higher eukaryotes. Cell Death Differ. 2009;16(8):1093-107. doi: 10.1038/cdd.2009.44. PubMed PMID: 19373242; PMCID: PMC2757140. View Article
[4] Galluzzi L, Vitale I, Abrams JM, Alnemri ES, Baehrecke EH, Blagosklonny MV, Dawson TM, Dawson VL, El-Deiry WS, Fulda S, Gottlieb E, Green DR, Hengartner MO, Kepp O, Knight RA, Kumar S, Lipton SA, Lu X, Madeo F, Malorni W, Mehlen P, Nunez G, Peter ME, Piacentini M, Rubinsztein DC, Shi Y, Simon HU, Vandenabeele P, White E, Yuan J, Zhivotovsky B, Melino G, Kroemer G. Molecular definitions of cell death subroutines: recommendations of the Nomenclature Committee on Cell Death 2012. Cell Death Differ. 2012;19(1):107-20. doi: 10.1038/cdd.2011.96. PubMed PMID: 21760595; PMCID: PMC3252826. View Article
[5] Li M, Chen X, Ye QZ, Vogt A, Yin XM. A high-throughput FRET-based assay for determination of Atg4 activity. Autophagy. 2012;8(3):401-12. doi: 10.4161/auto.18777. PubMed PMID: 22302004; PMCID: PMC3337841. View Article
[6] Lum JJ, DeBerardinis RJ, Thompson CB. Autophagy in metazoans: cell survival in the land of plenty. Nature reviews Molecular cell biology. 2005;6(6):439-48. doi: 10.1038/nrm1660. PubMed PMID: 15928708. View Article
[7] Komatsu M, Kominami E, Tanaka K. Autophagy and neurodegeneration. Autophagy. 2006;2(4):315-7. PubMed PMID: 16874063. View Article
[8] Jin S, White E. Role of autophagy in cancer: management of metabolic stress. Autophagy. 2007;3(1):28-31. PubMed PMID: 16969128; PMCID: PMC2770734. View Article
[9] Kroemer G, Levine B. Autophagic cell death: the story of a misnomer. Nature reviews Molecular cell biology. 2008;9(12):1004-10. doi: 10.1038/nrm2529. PubMed PMID: 18971948; PMCID: PMC2727358. View Article
[10] Baehrecke EH. Autophagy: dual roles in life and death? Nature reviews Molecular cell biology. 2005;6(6):505-10. doi: 10.1038/nrm1666. PubMed PMID: 15928714. View Article
[11] Nakatogawa H, Suzuki K, Kamada Y, Ohsumi Y. Dynamics and diversity in autophagy mechanisms: lessons from yeast. Nature reviews Molecular cell biology. 2009;10(7):458-67. doi: 10.1038/nrm2708. PubMed PMID: 19491929. View Article
[12] Mizushima N. Autophagy: process and function. Genes & development. 2007;21(22):2861-73. doi: 10.1101/gad.1599207. PubMed PMID: 18006683. View Article
[13] Shpilka T, Weidberg H, Pietrokovski S, Elazar Z. Atg8: an autophagy-related ubiquitin-like protein family. Genome Biol. 2011;12(7):226. doi: 10.1186/gb-2011-12-7-226. PubMed PMID: 21867568; PMCID: PMC3218822. View Article
[14] Klionsky DJ, Abeliovich H, Agostinis P, Agrawal DK, Aliev G, Askew DS, Baba M, Baehrecke EH, Bahr BA, Ballabio A, Bamber BA, Bassham DC, Bergamini E, Bi X, Biard-Piechaczyk M, Blum JS, Bredesen DE, Brodsky JL, Brumell JH, Brunk UT, Bursch W, Camougrand N, Cebollero E, Cecconi F, Chen Y, Chin LS, Choi A, Chu CT, Chung J, Clarke PG, Clark RS, Clarke SG, Clave C, Cleveland JL, Codogno P, Colombo MI, Coto-Montes A, Cregg JM, Cuervo AM, Debnath J, Demarchi F, Dennis PB, Dennis PA, Deretic V, Devenish RJ, Di Sano F, Dice JF, Difiglia M, Dinesh-Kumar S, Distelhorst CW, Djavaheri-Mergny M, Dorsey FC, Droge W, Dron M, Dunn WA, Jr., Duszenko M, Eissa NT, Elazar Z, Esclatine A, Eskelinen EL, Fesus L, Finley KD, Fuentes JM, Fueyo J, Fujisaki K, Galliot B, Gao FB, Gewirtz DA, Gibson SB, Gohla A, Goldberg AL, Gonzalez R, Gonzalez-Estevez C, Gorski S, Gottlieb RA, Haussinger D, He YW, Heidenreich K, Hill JA, Hoyer-Hansen M, Hu X, Huang WP, Iwasaki A, Jaattela M, Jackson WT, Jiang X, Jin S, Johansen T, Jung JU, Kadowaki M, Kang C, Kelekar A, Kessel DH, Kiel JA, Kim HP, Kimchi A, Kinsella TJ, Kiselyov K, Kitamoto K, Knecht E, Komatsu M, Kominami E, Kondo S, Kovacs AL, Kroemer G, Kuan CY, Kumar R, Kundu M, Landry J, Laporte M, Le W, Lei HY, Lenardo MJ, Levine B, Lieberman A, Lim KL, Lin FC, Liou W, Liu LF, Lopez-Berestein G, Lopez-Otin C, Lu B, Macleod KF, Malorni W, Martinet W, Matsuoka K, Mautner J, Meijer AJ, Melendez A, Michels P, Miotto G, Mistiaen WP, Mizushima N, Mograbi B, Monastyrska I, Moore MN, Moreira PI, Moriyasu Y, Motyl T, Munz C, Murphy LO, Naqvi NI, Neufeld TP, Nishino I, Nixon RA, Noda T, Nurnberg B, Ogawa M, Oleinick NL, Olsen LJ, Ozpolat B, Paglin S, Palmer GE, Papassideri I, Parkes M, Perlmutter DH, Perry G, Piacentini M, Pinkas-Kramarski R, Prescott M, Proikas-Cezanne T, Raben N, Rami A, Reggiori F, Rohrer B, Rubinsztein DC, Ryan KM, Sadoshima J, Sakagami H, Sakai Y, Sandri M, Sasakawa C, Sass M, Schneider C, Seglen PO, Seleverstov O, Settleman J, Shacka JJ, Shapiro IM, Sibirny A, Silva-Zacarin EC, Simon HU, Simone C, Simonsen A, Smith MA, Spanel-Borowski K, Srinivas V, Steeves M, Stenmark H, Stromhaug PE, Subauste CS, Sugimoto S, Sulzer D, Suzuki T, Swanson MS, Tabas I, Takeshita F, Talbot NJ, Talloczy Z, Tanaka K, Tanaka K, Tanida I, Taylor GS, Taylor JP, Terman A, Tettamanti G, Thompson CB, Thumm M, Tolkovsky AM, Tooze SA, Truant R, Tumanovska LV, Uchiyama Y, Ueno T, Uzcategui NL, van der Klei I, Vaquero EC, Vellai T, Vogel MW, Wang HG, Webster P, Wiley JW, Xi Z, Xiao G, Yahalom J, Yang JM, Yap G, Yin XM, Yoshimori T, Yu L, Yue Z, Yuzaki M, Zabirnyk O, Zheng X, Zhu X, Deter RL. Guidelines for the use and interpretation of assays for monitoring autophagy in higher eukaryotes. Autophagy. 2008;4(2):151-75. PubMed PMID: 18188003; PMCID: PMC2654259. View Article
[15] Barth S, Glick D, Macleod KF. Autophagy: assays and artifacts. J Pathol. 2010;221(2):117-24. doi: 10.1002/path.2694. PubMed PMID: 20225337; PMCID: PMC2989884. View Article
[16] Ishikawa-Ankerhold HC, Ankerhold R, Drummen GPC. Advanced Fluorescence Microscopy Techniques—FRAP, FLIP, FLAP, FRET and FLIM. Molecules. 2012;17(4):4047. PubMed PMID: doi:10.3390/molecules17044047. View Article
[17] Didenko VV. DNA probes using fluorescence resonance energy transfer (FRET): designs and applications. Biotechniques. 2001;31(5):1106-16, 18, 20-1. doi: 10.2144/01315rv02. PubMed PMID: 11730017; PMCID: PMC1941713. View Article
[18] Zadran S, Standley S, Wong K, Otiniano E, Amighi A, Baudry M. Fluorescence resonance energy transfer (FRET)-based biosensors: visualizing cellular dynamics and bioenergetics. Appl Microbiol Biotechnol. 2012;96(4):895-902. doi: 10.1007/s00253-012-4449-6. PubMed PMID: 23053099. View Article
[19] Song Y, Madahar V, Liao J. Development of FRET Assay into Quantitative and High-throughput Screening Technology Platforms for Protein-Protein Interactions. Ann Biomed Eng. 2011;39(4):1224-34. Epub 2010/12/22. doi: 10.1007/s10439-010-0225-x. PubMed PMID: 21174150; PMCID: 3069323. View Article
[20] Strianese M, Staiano M, Ruggiero G, Labella T, Pellecchia C, D'Auria S. Fluorescence-based biosensors. Methods Mol Biol. 2012;875:193-216. doi: 10.1007/978-1-61779-806-1_9. PubMed PMID: 22573441. View Article
[21] Bhalla N, Jolly P, Formisano N, Estrela P. Introduction to biosensors. Essays Biochem. 2016;60(1):1-8. doi: 10.1042/EBC20150001. PubMed PMID: 27365030; PMCID: PMC4986445. View Article
[22] Liu Y, Song Y, Madahar V, Liao J. Quantitative Forster resonance energy transfer analysis for kinetic determinations of SUMO-specific protease. Anal Biochem. 2012;422(1):14-21. doi: 10.1016/j.ab.2011.12.019. PubMed PMID: 22244808. View Article
[23] Song Y, Rodgers VG, Schultz JS, Liao J. Protein interaction affinity determination by quantitative FRET technology. Biotechnol Bioeng. 2012;109(11):2875-83. Epub 2012/06/20. doi: 10.1002/bit.24564. PubMed PMID: 22711490. View Article
[24] Jiang L, Saavedra AN, Way G, Alanis J, Kung R, Li J, Xiang W, Liao J. Specific substrate recognition and thioester intermediate determinations in ubiquitin and SUMO conjugation cascades revealed by a high-sensitive FRET assay. Mol Biosyst. 2014;10(4):778-86. doi: 10.1039/c3mb70155g. PubMed PMID: 24452848. View Article
[25] Liu Y, Song Y, Jiang L, Liao J. Quantitative analysis of FRET assay in biology—new developments in protein interaction affinity and protease kinetics determinations in the SUMOylation cascade. Frontiers in Biology. 2012;7(1):57-64. doi: 10.1007/s11515-011-1164-0. View Article
[26] Jiang L, Liu Y, Song Y, Saavedra AN, Pan S, Xiang W, Liao J. Internal calibration forster resonance energy transfer assay: a real-time approach for determining protease kinetics. Sensors (Basel). 2013;13(4):4553-70. Epub 2013/04/10. doi: 10.3390/s130404553 s130404553 [pii]. PubMed PMID: 23567524. View Article
[27] Li M, Hou Y, Wang J, Chen X, Shao ZM, Yin XM. Kinetics comparisons of mammalian Atg4 homologues indicate selective preferences toward diverse Atg8 substrates. J Biol Chem. 2011;286(9):7327-38. doi: 10.1074/jbc.M110.199059. PubMed PMID: 21177865; PMCID: PMC3044989. View Article
[28] Nguyen AW, Daugherty PS. Evolutionary optimization of fluorescent proteins for intracellular FRET. Nat Biotechnol. 2005;23(3):355-60. PubMed PMID: 15696158.
View Article