Journal of Biomedical Engineering and Biosciences (JBEB)
ISSN: 2564-4998

Volume 7 - Year 2020 - Pages 1-12
DOI: 10.11159/jbeb.2020.001
Diagnosis of STEMI and Non-STEMI Heart Attack using Nature-inspired Swarm Intelligence and Deep Learning Techniques
Mohammad Mahbubur Rahman Khan Mamun, Ali Alouani
Tennessee Technological University, Department of Electrical and Computer Engineering
1 William L Jones Dr, Cookeville, Tennessee, USA 38505
Mrkhanmamu42@tntech.edu; aalouani@tntech.edu
Abstract - Acute heart attack is associated with 30% mortality rate, among those 50% of death occur before arriving to a hospital. The ST elevated myocardial infarction (STEMI) and non-STEMI heart condition may lead to heart attack which can be prevented if detected ahead of time. 2D convolutional neural network (CNN) uses 2D data has been successfully applied to machine vision, plant disease diagnosis and medical field. Acquiring 2D images such as CT, MRI, and PET data can be prohibitively expensive. On the other hand, there are many 1D biomedical signals, such as ECG, that is more affordable and can be used for medical diagnosis of heart diseases as an example. The purpose of this paper is to propose the use of 1D CNN for medical diagnosis relying on more affordable 1D biomedical signal. To reduce the computational burden and enhance performance, the firefly algorithm (FA) is first applied to reduce the number of features needed for classification by the 1D CNN. The proposed 1D CNN combined with FA technique was applied to STEMI and Non-STEMI heart attack diagnosis using ECG signals. The method was trained and tested using A clinically available synchronously acquired ECG signal database from physionet was used to train and evaluate the performance of the proposed technique. The correctly classified outcome using FACNN is 84.84% with kappa statistics of .693, while average performance from other popular machine learning algorithm were 78.54% correctly classified outcome and kappa statistics of .56.
Keywords: firefly algorithm, deep learning, convolutional neural network, heart attack prediction.
© Copyright 2020 Authors This is an Open Access article published under the Creative Commons Attribution License terms. Unrestricted use, distribution, and reproduction in any medium are permitted, provided the original work is properly cited.
Date Received: 2020-10-05
Date Accepted: 2020-10-17
Date Published: 2020-10-26
1. Introduction
Cardiovascular disease (CVD) and stroke are the two leading cause of death in the world. About 735,000 people in the U.S. have heart attacks each year, of those about 120,000 die [1]. According to World Health Organization (WHO) approximately 17.7 million people died from CVDs in 2015 [2]. These statistics alone are sufficient to signify the importance of studying cardiovascular activity of human so that necessary measures can be taken to prevent any potential severe consequence. Since many features from a heart signal reflect the function of the heart, it is difficult for the physician to quickly and accurately perform diagnosis. Correct early detection of heart attack can provide the chance to patient to take proper medication, lifestyle change or surgery if necessary before it is too late [3]. Two major types of acute coronary syndromes (ACS) which will be the focus of this paper are NSTEMI and STEMI. The unstable angina which is another type of ACS is least serious since the blood supply to the heart is still seriously restricted, but there is no permanent damage, so the heart muscle is preserved. By employing computerized technologies for mentioned heart disease diagnosis, the physician can come to a faster and more accurate diagnosis.
2. Related Work
The CNNs have become the trend technique in image classification problems [4]-[16]. CT is widely used in screening procedures to reduce high mortality and to obtain many details about lungs nodules and the surrounding structures, 2D CNN has demonstrated outstanding performance in applications including 2 vision and images to detect lung cancer [17]. Structural and functional neuro images, such as magnetic resonance images (MRI) and positron emission tomography (PET), are providing powerful imaging modalities to help understand the anatomical and functional neural changes related to Alzheimer’s disease (AD),[18] proposes to construct cascaded convolutional neural networks (CNNs) to learn the multi-level and multimodal features of MRI and PET brain images for AD classification. The reason behind the success of 2D CNN for image classification can be explained in terms of network dimension reduction. The number of parameters of a typical neural network increases significantly with the increment of number of layers, which make the model computationally heavy, tuning the parameters due to being very high in number becomes very cumbersome work. The 2D CNN has reduced number of fully connected layer which reduces the number of parameters to be tuned. Even before the fully connected layer in 2D CNN, multiple convolutional filters work to carry out the dimensionality reduction using complete feature matrix. Since medical data for example: electrocardiogram (ECG) are time series data so operating on this kind of signal does not require 2D CNN rather 1D CNN and if diagnosis can be done using time series data, it saves the patient financially by not doing expensive test such as: MRI, CT, PET etc.
Currently, there are several heart disease diagnosis systems being proposed by researchers. Integration of different techniques together to make hybrid models (combining machine learning, statistical model, and optimization algorithm) is prominent because they perform better than the use of a single technique [19]-[24]. Many researchers have investigated feature selection for heart disease diagnosis, prominently based on support vector machine (SVM) [23]. SVM classifier was combined with forward feature inclusion [19] and uses multivariable adaptive regression splines to reduce the set of explanatory features [25], then use particle swarm optimization (PSO) [26]. Recently, rough set theory has been used to investigate data dependencies and reduction of data attributes. Also greedy heuristics were applied to find attribute reduction based on rough set [27], [28]. Though these approaches are fast, but they may work for the heuristic feature selection only. Using the dependency function to discriminate between candidates may lead the search down a non-minimal path; in short dependency among the selected feature has not been done. It is impossible to predict which combinations of attributes will lead to an optimal reduction based on changes in dependency with the addition or deletion of single attributes [29]-[31]. Metaheuristic algorithms were applied for attribute reduction based on rough set were also investigated [29]-[31]. Firefly algorithm is one of the recent swarm intelligence techniques that rely on flashing behavior of fireflies in nature which finds the global optimal solution (best solution among all the local solution) in the search space and is used to solve many difficult combinational optimization problems [32]. FA showed higher success rate than PSO or genetic algorithm by being better at exploration as well as diversification because the firefly algorithm can subdivide the whole population into subgroups automatically in terms of the attraction mechanism via the variation of light intensity and one of the FA variants can escape from the local minima owing to long-distance mobility, [33].
Researchers have utilized several computer-aided heart disease detection methods using clinical data, such as: decision trees [34], support vector machine [35], ensemble machine learning [36], rotation forest classifier [37], K-star algorithm [38], neuro fuzzy classifier [39], Bayesian algorithm[40], artificial neural network (ANN) [41] and rule organization method [42], [43], etc. Most of these approaches use heart rate variability (HRV) as an accurate marker for heart disease. However, building HRV based model is time consuming as well as prone to error due to large amount of preprocessing and manual selection of appropriate features [44]. Several ANN based hybrid models are widely adopted in medical diagnosis due to their ability of handling complex linear as well as non-linear models [45]-[48]. Though these ANN-based methods provide useful decision support system to an extent, the attributes for heart disease are generally assumed to have equal contribution for diagnosis of heart conditions. However, several researches provided proof that the heart disease attributes have varying range of contributions to the overall outcome of disease diagnosis [49]-[51].
A deep learning neural network consists of one input layer, several hidden layers and one output layer. The input data is transformed throughout the layers of a deep learning neural network by artificial neurons or processing units, the chain of transformation is a proxy for the measurement of ‘depth’ in a deep learning model architecture. Increased computation in model and algorithmic complexity can result in significant computational resource and time requirement. Furthermore, the solutions for classification algorithm may represent local minima as opposed to the global minima [52]. The deep learning (DL) community has created impactful advances across diverse application domains by following a straightforward recipe: search for improved model architectures, create large training data sets, and scale computation. While model architecture search can be unpredictable, the model accuracy improvements from growing data set size and scaling computation are empirically evident [52].
In an attempt to improve medical diagnosis using computer based techniques, [53]-[55], among others, used a combination of optimization algorithm and 2DCNN for medical image analysis. The regular task of 2D CNN is to classify image into patterns, addition of any optimization algorithm such as: FA, PSO, GA etc. help to hyper-parameters to optimize which improved the solution (diagnosis) quality and performance [53], [55], For image or 2D data the performance of CNN is much better than typical neural network due to reduction in dimension using convolution, subsampling layers. Using the success of 2D CNN for medical imagery data, the combination of optimized feature and 1D CNN can be implemented for time series biomedical data to diagnosis disease. The same process can be applied to 1D sequence of data by extracting feature from the sequences and map the internal feature of the sequence. Compared to the 2D-CNN, the use of 1D-CNN for fixed length of physiological signal is computationally much more attractive. 1D CNN performs better in terms of accuracy for analysis of time series of sensor data and signal data over fixed length period compared to 2D-CNN with two dimensional representations of same data in image form [56]. The 1D-CNN is able to reduce network units using convolution layers. The use of FA-CNN provides faster global optima than other swarm intelligence algorithms [18]. It has superior performance over other classification techniques using physiological signals [57]-[59], which have used 1D CNN only.
In this paper, we propose an integrated decision support system for STEMI and Non-STEMI heart attack detection based on efficient hyperplane framework with 1D-CNN that utilizes one of the most well-known natural inspired swarm intelligence systems called firefly algorithm (FA). To the best of the authors’ knowledge, this method is the first one used to investigate the performance of FA-1D-CNN using 1D physiological signal. Combining the ability of FA to reach faster global optimization solution compared to other meta-heuristic algorithms and the ability of 1D-CNN to result in less computationally intensive and more accurate classification using time series sensor data compare to 2D representation can result in implementation of FA1D-CNN as a better solution.
The proposed method involves two sequential steps, firstly FA is used to properly rank and optimize the number of features or attributes, and secondly the chosen optimized attributes are applied to train a 1DCNN classifier using an online dataset called Physikalisch-Technische Bundesanstalt (PTB) diagnostic ECG Database for prediction of heart attack [60]. Tenfold cross validation strategy has been used to evaluate the performance of the trained model to diagnose specific heart diseases such as: STEMI and nonSTEMI heart attack.
3. Materials and Methods
In sections 3.1 & 3.2, the background for FA and 1D CNN are provided. In section 3.3, the clinical data for heart attack are discussed.
3. 1. Nature inspired swarm intelligence: Firefly algorithm
Processing features instead of raw data reduces the computational complexity and leads to a faster diagnosis. The quality of the diagnosis depends heavily on the features selected. Selecting the minimum features with complementary information leads to a better a better diagnosis than one a larger number of correlated/dependent features is used. Here, the FA algorithm has been, Firefly algorithm is a multimodal optimization algorithm to select or reduce attribute based on flashing characteristics of fireflies in nature. The main assumption is each firefly or feature which is extracted from data moves towards more attractive (brighter) solutions/features (fireflies). Since the real firefly behaviour is much more complex and sophisticated, it requires some simplified rules to use in practical diagnoses. According to [32], fireflies/features have three major attributes towards other fireflies/features as principles: 1. Regardless of their gender (the position of feature depends on brightness or fitness function only), the light intensity of a firefly representing the solution is proportional to the value of fitness function. 2. The brighter they are, the more attractive they become towards other fireflies/features, 3. Computation of brightness is based on an objective function; distance between fireflies is inversely proportional to brightness and attractiveness [32], [33].
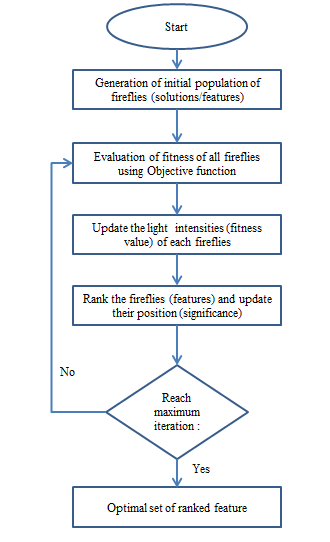
Feature selection not only records the learned models with an efficient computational cost but also enhances their performances in solving decision support problems. In general, the subsets of attributes differ from each other in the length and attributes contained in each subset. Finding the optimal attribute reduction is a NP-hard problem [61]. As a general limitation of most of the meta-heuristic algorithms, the fitness functions based on quality of approximation of classification and a solution to that is highest value of fitness function. So with no prior feature optimization the set of feature totally depends on classification algorithm. To solve this problem, FA can be used as follows. Each subset of attributes or features can be seen as a point or position of firefly in search space, the optimal position is the subset of attributes or features with least length or highest value from fitness test. FA technique possesses great capabilities in finding global optima, and employs a swarm-based strategy to yield multiple solutions in a single run. Also, it takes feature interaction into account and evaluates each selected feature subset as a group using fitness evaluation. Based on the fitness evaluation, the ranking of the features (fireflies) is updated. After maximum interaction the optimum set of features is the output of FA. In heart disease (STEMI and non-STEMI heart attack) diagnosis, the number of initial features after pre-processing and extraction will be reduced and optimized using evaluation of fitness function of each of the features and ranking will be done by updating their position.
Firefly algorithm has two parameters: the variation in light intensity and the attractiveness of firefly to each other. The light intensity L(r) changes inversely proportional to square of distance according to following formula in Eq. (1), [32]:

Where, the intensity of the light source is L(r) proportional to the value of fitness function and the fitness function is LS for a maximization problem. LO is the intensity at the source (r=0) or can be used as attractiveness or fitness function value at the source, and for a fixed air absorption coefficient “γ”, the light intensity L varies with distance “r” as shown in Eq. (2) [32]:

Figure 1 shows the flowchart of the firefly algorithm.
The combination of effects from inverse square law and the absorption law can be expressed as an approximation as Eq. (3), [32]

The attractiveness A of any firefly is proportional to its light intensity of other fireflies adjacent to and AO is the attractiveness at r=0,

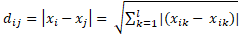
The distance dij between two fireflies i and j at point xi and xj in Cartesian coordinate system is as follows:
The firefly i can travel towards firefly j using Eq. (6) at time ‘t’, [32]:

The first part of Eq. (6) denotes the current location of firefly i at time ‘t’, the second term is used to determine the attractiveness (A) of a firefly towards a neighbouring firefly, and the third term indicates the random walk of a firefly. When the firefly i does not find an attractive firefly j nearby, then it will go for a random walk using the third part of Eq. (6), where α is a randomization parameter and rand ([0, 1]) function generator. FA is controlled by three parameters: the randomization parameter α, the absorption coefficient γ and the attractiveness A. FA shows two distinguished asymptotic behaviour, when γ is zero, A becomes AO and when γ becomes infinity, the second part in Eq. (6) vanishes and the firefly movement becomes a random walk.
3. 2. Convolutional neural network
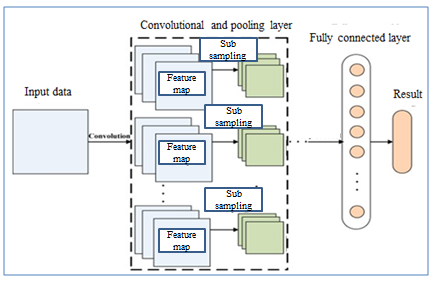
Convolutional neural network are similar to artificial neural network (ANN) in a way that they are also comprised of neurons that self-optimize through learning. There is an input layer, a number of hidden layers and an output layer in both cases. The major difference between them is that in CNN only the last layer is fully connected, but in ANN all the layers are fully connected. Also, in CNN the hidden layers are named differently due to their functionality such as: convolution layer, the rectified linear unit, pooling layer, etc. In Fig.2 a common architecture of convolutional neural network comprised of the different layers is shown.
The typical CNN consist of three layer named as convolutional layer, pooling layer and fully-connected layer. The convolutional layer uses different kernel to compute feature maps. Each node of feature map is connected to the other nodes in neighbouring region of previous layer. After convoluting the input with a learned kernel and applying the element wise nonlinear activation function on the convolved results provides the new feature map while the kernel is shared by all spatial location of the input. The pooling layer objective is to achieve shift invariance by reducing the resolution of the feature maps. It’s common to periodically insert pooling layer in between successive convolution layer to progressively reduce the special size of the representation to reduce the amount of parameter and computation of the network. The most common form of pooling layer is with filter 2X2 applied with a stride 2 to discard 75% of the activations [63]. The flattened outputs from combination of convolutional and pooling layers are fed into a feed-forward neural network.
Convolutional models were developed primarily for image classification by feature learning where the model accepts two dimensional inputs representing image pixels. When it comes to one dimensional data, the same protocol can be followed by accepting one dimensional data as sequence. 1D CNN is very effective in deriving features from fixed length segment of overall dataset [64]. 1D CNN is an alternative version of 2D CNN when dealing with one dimensional data. This makes it attractive when it comes to diagnosis using biomedical signals such as ECG. 1D CNN has shallower architecture than the 2D counterpart, 2D CNN requires cloud computing or GPU, while 1D CNN can be implemented using a standard computer, due to its low computational requirement. This network is well suited for real time and low computation powered applications. Three consecutive CNN layers of a 1D CNN are shown in fig. 3, [65].
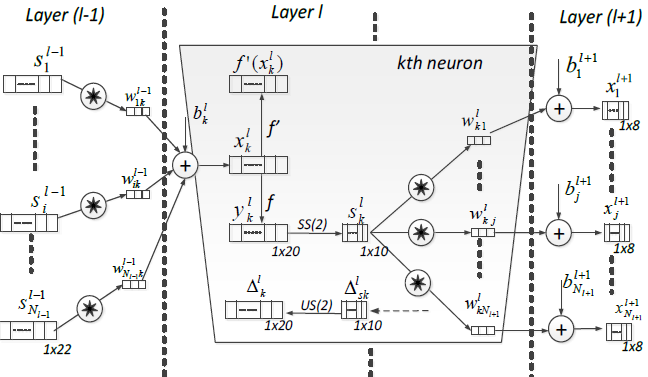
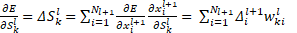
In each CNN layer, the 1D forward propagation is expressed as:

Where, ![]() is as input,
is as input, ![]() is bias of kth neuron at layer ‘l’,
is bias of kth neuron at layer ‘l’,![]() is the output of ith neuron at layer
l-1,
is the output of ith neuron at layer
l-1, ![]() is the kernel from the ith neuron
at layer l-1 to the kth neuron at layer l. if the tp is the target and
is the kernel from the ith neuron
at layer l-1 to the kth neuron at layer l. if the tp is the target and ![]() is the output vector respectively,
the mean-squared error (MSE) can be obtained as follows :
is the output vector respectively,
the mean-squared error (MSE) can be obtained as follows :

From the first multi-layer perceptron (MLP) to the last convolutional neural network layer, the regular back propagation is done as,
3. 3. Dataset
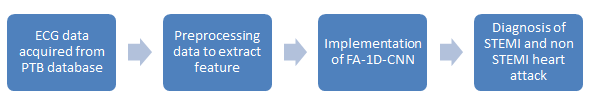
In the study, the PTB Diagnostic ECG Database [60] was used to train, validate and evaluate the performance of the proposed hybrid model identifying heart attacks among patients. As shown in fig.4, the process starts by acquiring ECG data from PTB database. The database consists of 80 recordings from 54 healthy subject and 368 recordings of heart disease such as Heart attack from 148 patients. Each recording in the PTB database contains 15 synchronously recorded signals which are 12 lead ECG and three orthogonal leads [60]. Each signal is digitized at 1000 samples per second with 16-bit resolution over a range of +/- 16.384 mV. Within the header file of most of these ECG records is a detailed clinical summary, including age, gender, diagnosis, and where applicable, data on medical history, medication and interventions, coronary artery pathology, ventriculography, echocardiography, and hemodynamic [60].
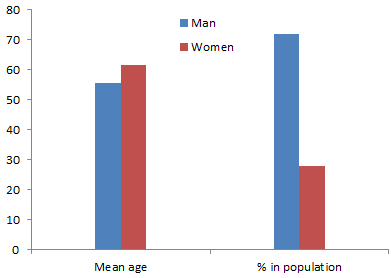
Age of patients ranges from 17 to 87 with mean 57.2 years, 209 men with mean age 55.5 and 81 women with mean age 61.6 as shown in figure 4. In figure 5, the process of diagnosis of heart attack using ECG data from PTB database has been shown.
4. Materials and Methods
In section 4.1, the data pre-processing is discussed. In sections 4.2 the implementations of firefly along with one dimensional convolutional neural network to diagnose STEMI and non-STEMI heart attack have been discussed.
4. 1. Data Pre-processing
The ECG signal consists of PQRTS waves to represent the activity of the heart. When atrial contraction happens the P wave goes up, it records the electrical activity of the heart muscles when the blood flows from atrial to ventricles. Duration of P wave is usually .11 seconds and amplitude is 2.5mm. The QRS wave represents the ventricular contraction which has the maximum amplitude during a heartbeat, it represents the electrical signal generation due to blood rushing from ventricles to the right atrium. ST segments represents the time duration between the ventricular depolarization and repolarization.
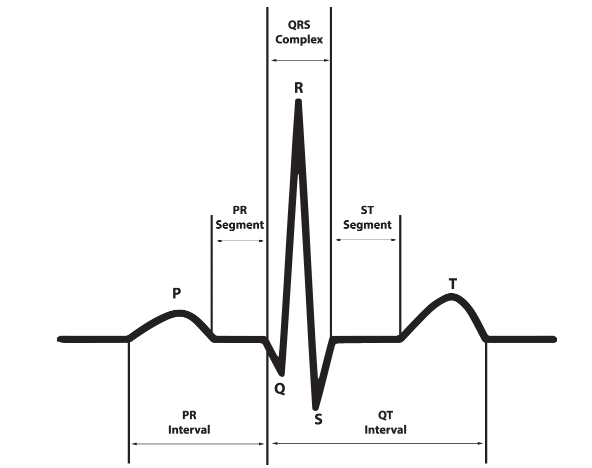
Table 1. Some of the ECG features & normal durations [62]
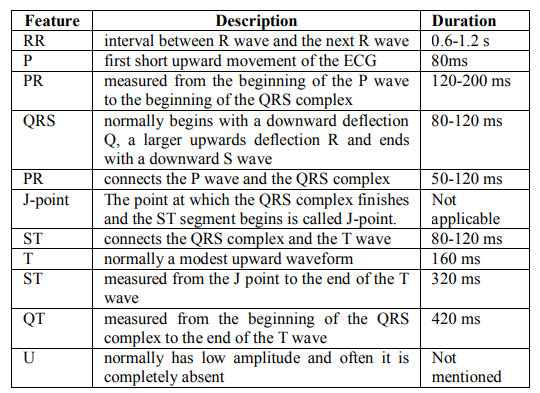
Figure 6 shows the ECG waveform and segments in lead II for a normal cardiac cycle and in Table 1, the ECG features and normal durations are reported.
Primary diagnostic can be obtained from patients’ ECG trace by discovering specific features. Depending on the occurrence of features in different leads, a conclusion can be reached about where the infarction is occurring. A raw ECG signal is inherently noisy due to different interference such as power line, electromagnetic interference, body movement, respiration, etc. All these noises combine into baseline wanders which needs to be removed before performing further signal processing.
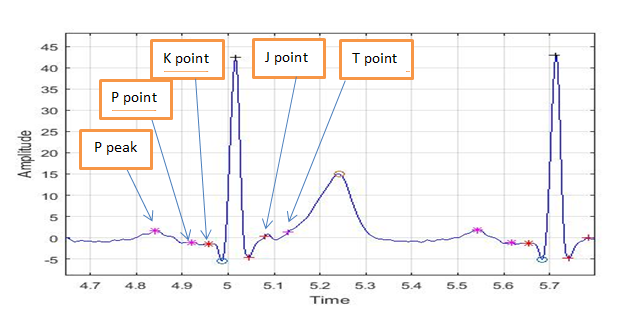
To get a normalized signal, the drift in the ECG signal has to be computed. The proposed work flow to get signal without baseline wander removed is as follows. First, the raw signal will be filtered by FIR low pass filter, then two different median filters are used to eliminate the QRS complex, then subtract from the original low passed filtered signal. ECG signal is a non-stationary signal that has different frequencies. To preserve the temporal occurrence of the signal frequencies, it is necessary to use a transform which can be useful in both time and frequency domains. Using temporal feature conversation ability of bi-orthogonal wavelet transform, the features such as PQRST peak and ST segments can be calculated [68].
In Fig.7, the peaks and points of a typical ECG have been extracted.
4. 2. Implementation of FA-1D-CNN
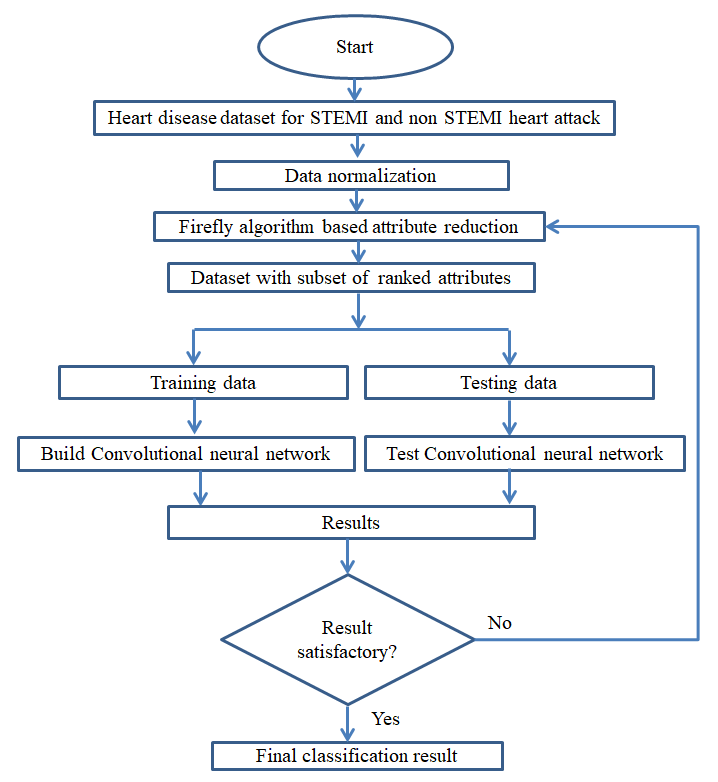
In figure 8, the whole disease (STEMI and non-STEMI heart attack) diagnosis system is shown. The system begins with putting the dataset through normalization and FA for optimized set of features. Normalization is done to avoid numerical complexities where feature with greater numeric range can’t dominate feature with smaller range. After normalization the dataset is ready for feature reduction.
Next, FA process started with two steps: exploitation (intensification) and diversification (diversification). Using Eq. (6), the movement of a feature (firefly) is decided and the diversification is done by changing the parameter γ and A. When γ=0 then A=AO and in that case the value of A is the largest possible and the solution moves towards other solution with largest possible leap so the diversification is minimum, while the exploitation is maximum. On the other hand, when γ is infinity then A=0, so each feature (solution) moves in a random way so there is no exploitation at all. By adjusting the values of γ and A the trade-off between exploitation and exploration is determined. The feature space with each feature represented in an individual dimension and it requires an intelligent search method to find optimal point in that space that maximizes the given fitness function.
ECG featured before optimizations were 180 feature points from each segment of 448 ECG records, it will be added with 10 more features from intervals mention in table 1. The algorithm used as fitness function or objective function is information gain to calculate the light intensity in firefly algorithm. After that, ranking of the attributes based on the information gain of the attributes are done. Top features from the ranked features are selected. From the ranking of firefly algorithm 24 feature were selected as input for the CNN so that the convergence Increases. Here it was assumed that correct features were extracted during data pre-processing.
In this work, the proposed convolutional neural network consists of 6 layers including 2 convolutional layers, 2 max pooling layers and 2 fully-connected layers. In every convolution layer, the layers are convolved with the respective kernel (4 for 1st convolution layer, 3 for 2nd convolution layer). The stride for convolution and max-pooling layers are 1 and 2, respectively. The fully connected output layers have output neurons as 8 and 2, respectively. Using K-fold cross validation technique [69], here only ten-fold cross validation has been applied, where the total patient number is randomly divided into 10 equal clusters, where 9 were used to train for the proposed model and 1 to validate the diagnosis effectiveness.
5. Performance Evaluation
To provide a comparison among classification techniques, the following evaluation parameters were used: correctly classified, incorrectly classified, kappa statistics, mean absolute error, true positive (TP) rate, false positive (FP) rate, precision, recall and F-measure. Kappa statistics (K_S) is defined as
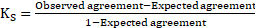
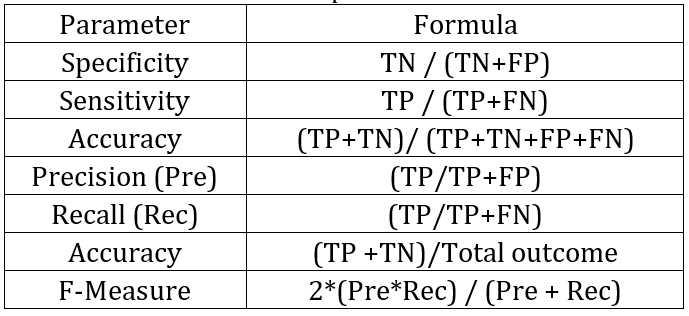
So when two measurements agree by chance, the K_S is zero and when two measurements agree perfectly the K_S value is 1.0. True positive rate when the model correctly predicts the positive class similarly, the false positive rate is an outcome when the model incorrectly predicts the positive class. The formula for specificity, accuracy sensitivity, precision, recall and accuracy are given in table 2:
Table 2. The definitions of performance characteristics.
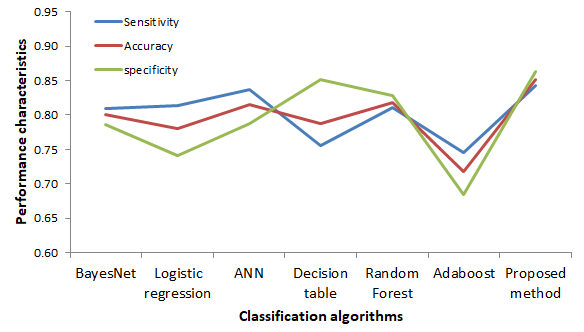
The sensitivity, accuracy and specificity comparison among algorithms is shown in figure 9. The kappa statistic test is nonparametric and measures degree of separation for the distribution of diagnosis result for heart attack in patients. It ranges from 0 to 100% and with higher kappa statistics value it indicates a better diagnostic model in detecting attack in patients. In our research our proposed model provides K_S value .70 which is higher than the other model tried.
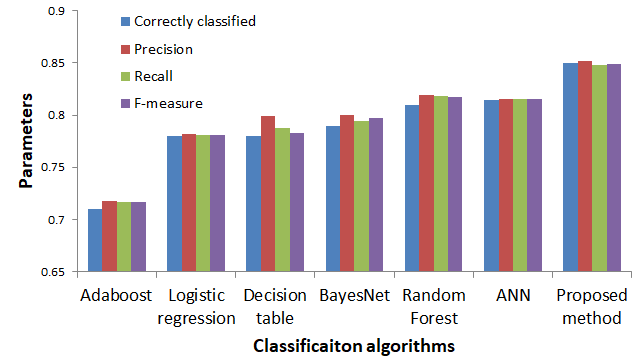
In figure 10, a comparison of statistical parameters related to the performance evaluation among the common classification techniques and the proposed method is shown. High precision means that an algorithm returned substantially more relevant results than irrelevant ones, while high recall means that an algorithm returned most of the relevant results.
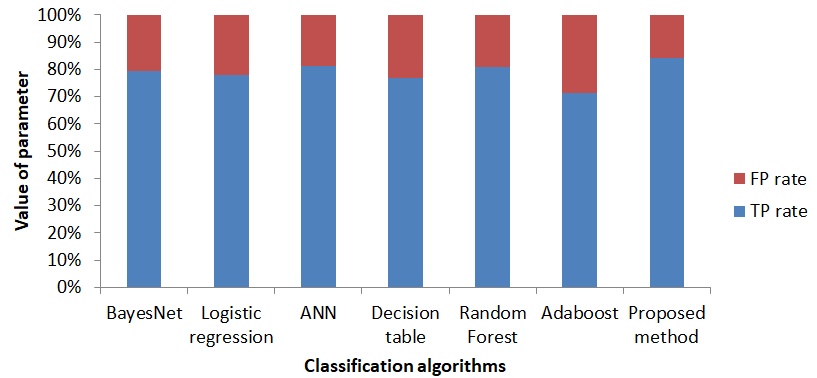
In Fig.11, the comparison of techniques with true positive and false positive predicted diagnosis is shown. All the results confirm that the proposed FA-CNN method outperforms the other machine learning techniques for detecting heart attack in terms of common statistical parameters.
6. Conclusion
A new classification algorithm model using physiological information was proposed. The model is a combination of firefly algorithm, a nature inspired swarm intelligence algorithm, and 1D convolutional neural network. The proposed FA-CNN model has been trained and tested using dataset containing physiological information of patient about their heart attack (STEMI and non STEMI). Using common statistical performance evaluation parameters, it’s evident that the proposed method performs better than the other common machine learning classification techniques in detecting mentioned heart diseases as shown in Table 2. The preliminary testing results of the study conducted in this paper are quite encouraging. Further studies will be carried out in the future.
Beside its performance, the proposed FA-1D CNN has the advantage of affordability in terms of the needed information as well as the lower computational complexity requirement when compared to 2D CNN. It is hoped that the proposed technique will lead to affordable diagnosis of heart and other diseases using 1D biomedical signal.
References
[1] heart.org, 2017. [Online]. Available: https://www.heart.org/idc/groups/ahamahpublic/@wcm/@sop/@smd/documents/downloadabl e/ucm_470704.pdf. [Accessed: 19- Apr- 2020].
[2] World Health Organization, “Cardiovascular diseases (CVDs),” 2017. [Online]. Available: http://www.who.int/mediacentre/factsheets/fs317/en/. [Accessed: 05-Jul-2020].
[3] E. G. Nabel and E. Braunwald, "A tale of coronary artery disease and myocardial infarction," N. Engl. J. Med., vol. 366, (1), pp. 54-63, 2012. View Article
[4] U. R. Acharya , U. Rajendra, Hamido Fujita, Oh Shu Lih, Yuki Hagiwara, Jen Hong Tan, and Muhammad Adam, "Automated detection of arrhythmias using different intervals of tachycardia ECG segments with convolutional neural network," Inf. Sci., vol. 405, pp. 81-90, 2017. View Article
[5] H. Greenspan, B. Van Ginneken and R. M. Summers, "Guest editorial deep learning in medical imaging: Overview and future promise of an exciting new technique," IEEE Trans. Med. Imaging, vol. 35, (5), pp. 1153-1159, 2016. View Article
[6] S. Pereira , Sérgio, Adriano Pinto, Victor Alves, and Carlos A. Silva, "Brain tumor segmentation using convolutional neural networks in MRI images," IEEE Trans. Med. Imaging, vol. 35, (5), pp. 1240-1251, 2016. View Article
[7] M. Kallenberg , Michiel, Kersten Petersen, Mads Nielsen, "Unsupervised deep learning applied to breast density segmentation and mammographic risk scoring," IEEE Trans. Med. Imaging, vol. 35, (5), pp. 1322-1331, 2016. View Article
[8] N. Hatipoglu and G. Bilgin, "Cell segmentation in histopathological images with deep learning algorithms by utilizing spatial relationships," Med. Biol. Eng. Comput., vol. 55, (10), pp. 1829-1848, 2017. View Article
[9] Mark J. J. P. van Grinsven ; Bram van Ginneken ; Carel B. Hoyng ; Thomas Theelen ; Clara I. Sánchez, "Fast convolutional neural network training using selective data sampling: Application to hemorrhage detection in color fundus images," IEEE Trans. Med. Imaging, vol. 35, (5), pp. 1273-1284, 2016. View Article
[10] Gulshan, V., Peng, L., Coram, M., Stumpe, M.C., Wu, D., Narayanaswamy, A., Venugopalan, S., Widner, K., Madams, T., Cuadros, J. and Kim, R, "Development and validation of a deep learning algorithm for detection of diabetic retinopathy in retinal fundus photographs," Jama, vol. 316, (22), pp. 2402-2410, 2016. View Article
[11] J. H. Tan , Jen Hong, U. Rajendra Acharya, "Segmentation of optic disc, fovea and retinal vasculature using a single convolutional neural network," Journal of Computational Science, vol. 20, pp. 70-79, 2017. View Article
[12] A. A. A. Setio , Arnaud Arindra Adiyoso, Francesco Ciompi, Geert Litjens, Paul Gerke, Colin Jacobs, Sarah J. Van Riel, Mathilde Marie Winkler Wille, "Pulmonary nodule detection in CT images: false positive reduction using multi-view convolutional networks," IEEE Trans. Med. Imaging, vol. 35, (5), pp. 1160-1169, 2016. View Article
[13] N. Tajbakhsh , Nima, Jae Y. Shin, Suryakanth R. Gurudu, "Convolutional neural networks for medical image analysis: Full training or fine tuning?" IEEE Trans. Med. Imaging, vol. 35, (5), pp. 1299-1312, 2016. View Article
[14] D. Ravì , Daniele, Charence Wong, Fani Deligianni, Melissa Berthelot, Javier Andreu-Perez, Benny Lo, "Deep learning for health informatics," IEEE Journal of Biomedical and Health Informatics, vol. 21, (1), pp. 4-21, 2016. View Article
[15] N. Le, Q. Ho and Y. Ou, "Incorporating deep learning with convolutional neural networks and position specific scoring matrices for identifying electron transport proteins," Journal of Computational Chemistry, vol. 38, (23), pp. 2000-2006, 2017.
[16] N. Q. K. Le , Quang-Thai Ho, "DeepETC: A deep convolutional neural network architecture for investigating and classifying electron transport chain's complexes," Neurocomputing, vol. 375, pp. 71-79, 2020. View Article
[17] Mamun, Mohammad Mahbubur Rahman Khan and A. T. Alouani, "FA-1D-CNN Implementation to Improve Diagnosis of Heart Disease Risk Level," 6th World Congress on Engineering and Computer Systems and Sciences, 2020, pp. 122.1-122.9.View Article
[18] M. Liu, D. Cheng, K. Wang, Y. Wang, "Multi-modality cascaded convolutional neural networks for Alzheimer’s disease diagnosis," Neuroinformatics, vol. 16, (3-4), pp. 295-308, 2018. View Article
[19] S. Shilaskar and A. Ghatol, "Feature selection for medical diagnosis: Evaluation for cardiovascular diseases," Expert Syst. Appl., vol. 40, (10), pp. 4146-4153, 2013. View Article
[20] Mamun, Mohammad Mahbubur Rahman Khan and A. T. Alouani, “Using Feature Optimization and Fuzzy Logic to Detect Hypertensive Heart Diseases," 6th World Congress on Electrical Engineering and Computer Systems and Sciences, 2020, pp. 128.1-128.9.View Article
[21] Mamun, Mohammad Mahbubur Rahman Khan and A. T. Alouani, "Myocardial Infarction Detection using Multi Biomedical Sensors," 10th International Conference on Bioinformatics and Computational Biology , 2018, pp. 117-122.
[22] A. Khemphila and V. Boonjing, "Heart disease classification using neural network and feature selection," in 2011 21st International Conference on Systems Engineering, 2011, pp. 406-409.View Article
[23] W. Guan, A. Gray and S. Leyffer, "Mixed-integer support vector machine," in NIPS Workshop on Optimization for Machine Learning, 2009, .
[24] E. Avci, "A new intelligent diagnosis system for the heart valve diseases by using genetic-SVM classifier," Expert Syst. Appl., vol. 36, (7), pp. 10618-10626, 2009. View Article
[25] Y. E. Shao, C. Hou and C. Chiu, "Hybrid intelligent modeling schemes for heart disease classification," Applied Soft Computing, vol. 14, pp. 47-52, 2014. View Article
[26] H. H. Inbarani, A. T. Azar and G. Jothi, "Supervised hybrid feature selection based on PSO and rough sets for medical diagnosis," Comput. Methods Programs Biomed., vol. 113, (1), pp. 175-185, 2014. View Article
[27] C. Velayutham and K. Thangavel, "Unsupervised quick reduct algorithm using rough set theory," Journal of Electronic Science and Technology, vol. 9, (3), pp. 193-201, 2011.
[28] S. Teng ,Shi-lin Zhou, Ji-xiang Sun, and Zhi-yong Li., "An efficient attribute reduction algorithm," in 2010 2nd International Conference on Advanced Computer Control, 2010, .
[29] D. Ye, Z. Chen and S. Ma, "A novel and better fitness evaluation for rough set based minimum attribute reduction problem," Inf. Sci., vol. 222, pp. 413-423, 2013. View Article
[30] X. Wang , Jie Yang, Xiaolong Teng, Weijun Xia, and Richard Jensen, "Feature selection based on rough sets and particle swarm optimization," Pattern Recog. Lett., vol. 28, (4), pp. 459-471, 2007. View Article
[31] H. H. Inbarani, A. T. Azar and G. Jothi, "Supervised hybrid feature selection based on PSO and rough sets for medical diagnosis," Comput. Methods Programs Biomed., vol. 113, (1), pp. 175-185, 2014. View Article
[32] X. Yang, "Firefly algorithms for multimodal optimization," in International Symposium on Stochastic Algorithms, 2009, pp. 169-178.View Article
[33] X. Yang, Nature-Inspired Metaheuristic Algorithms. Luniver press, 2010.
[34] M. Shouman, T. Turner and R. Stocker, "Using decision tree for diagnosing heart disease patients," in Proceedings of the Ninth Australasian Data Mining Conference-Volume 121, 2011, pp. 23-30.
[35] A. D. Dolatabadi, S. E. Z. Khadem and B. M. Asl, "Automated diagnosis of coronary artery disease (CAD) patients using optimized SVM," Comput. Methods Programs Biomed., vol. 138, pp. 117-126, 2017. View Article
[36] K. H. Miao, J. H. Miao and G. J. Miao, "Diagnosing coronary heart disease using ensemble machine learning," Int J Adv Comput Sci Appl (IJACSA), 2016. View Article
[37] A. Ozcift and A. Gulten, "Classifier ensemble construction with rotation forest to improve medical diagnosis performance of machine learning algorithms," Comput. Methods Programs Biomed., vol. 104, (3), pp. 443-451, 2011. View Article
[38] W. Wiharto, H. Kusnanto and H. Herianto, "Intelligence system for diagnosis level of coronary heart disease with K-star algorithm," Healthcare Informatics Research, vol. 22, (1), pp. 30-38, 2016. View Article
[39] H. R. Marateb and S. Goudarzi, "A noninvasive method for coronary artery diseases diagnosis using a clinically-interpretable fuzzy rule-based system," J. Res. Med. Sci., vol. 20, (3), pp. 214-223, Mar, 2015.
[40] R. Detrano , Andras Janosi, Walter Steinbrunn, Matthias Pfisterer, "International application of a new probability algorithm for the diagnosis of coronary artery disease," Am. J. Cardiol., vol. 64, (5), pp. 304-310, 1989. View Article
[41] O. Y. Atkov , Svetlana G. Gorokhova, Alexandr G. Sboev, "Coronary heart disease diagnosis by artificial neural networks including genetic polymorphisms and clinical parameters," J. Cardiol., vol. 59, (2), pp. 190-194, 2012. View Article
[42] D. Pal , K. M. Mandana, Sarbajit Pal, Debranjan Sarkar, and Chandan Chakraborty, "Fuzzy expert system approach for coronary artery disease screening using clinical parameters," Knowledge-Based Syst., vol. 36, pp. 162-174, 2012. View Article
[43] Mamun, Mohammad Mahbubur Rahman Khan and A. Alouani, "Using photoplethysmography & ECG towards a non-invasive cuff less blood pressure measurement technique," in 2019 IEEE Canadian Conference of Electrical and Computer Engineering (CCECE), 2019, pp. 1-4.View Article
[44] Ludwig M, Hoffmann K, Endler S, Asteroth A, Wiemeyer J., "Measurement, prediction, and control of individual heart rate responses to exercise—Basics and options for wearable devices," Frontiers in Physiology, vol. 9, pp. 778, 2018. View Article
[45] O. W. Samuel , Oluwarotimi Williams, Grace Mojisola Asogbon, "An integrated decision support system based on ANN and Fuzzy_AHP for heart failure risk prediction," Expert Syst. Appl., vol. 68, pp. 163-172, 2017. View Article
[46] O. W. Samuel, M. Omisore and B. Ojokoh, "A web based decision support system driven by fuzzy logic for the diagnosis of typhoid fever," Expert Syst. Appl., vol. 40, (10), pp. 4164-4171, 2013. View Article
[47] E. O. Olaniyi, O. K. Oyedotun and K. Adnan, "Heart diseases diagnosis using neural networks arbitration," International Journal of Intelligent Systems and Applications, vol. 7, (12), pp. 72, 2015. View Article
[48] İ Babaoglu, O. Findik and E. Ülker, "A comparison of feature selection models utilizing binary particle swarm optimization and genetic algorithm in determining coronary artery disease using support vector machine," Expert Syst. Appl., vol. 37, (4), pp. 3177-3183, 2010. View Article
[49] H. Wedel , John JV McMurray, Magnus Lindberg, John Wikstrand, "Predictors of fatal and non‐fatal outcomes in the Controlled Rosuvastatin Multinational Trial in Heart Failure (CORONA): incremental value of apolipoprotein A‐1, high‐sensitivity C‐reactive peptide and N‐terminal pro B‐type natriuretic peptide," European Journal of Heart Failure, vol. 11, (3), pp. 281-291, 2009. View Article
[50] M. Senni , Michele, Piervirgilio Parrella, Renata De Maria, Ciro Cottini, Michael Böhm., "Predicting heart failure outcome from cardiac and comorbid conditions: the 3C-HF score," Int. J. Cardiol., vol. 163, (2), pp. 206-211, 2013. View Article
[51] K. Rahimi, A. Patel and S. MacMahon, "Two decades of research on innovative models of care delivery for patients with heart failure: the end or just the beginning?" Archives of Iranian Medicine (AIM), vol. 15, (7), 2012.
[52] Hestness J, Narang S, Ardalani N, Diamos G, Jun H, Kianinejad H, Patwary M, Ali M, Yang Y, Zhou Y., "Deep learning scaling is predictable, empirically," arXiv Preprint arXiv:1712.00409, 2017.
[53] M. Elhoseny and K. Shankar, "Optimal bilateral filter and convolutional neural network based denoising method of medical image measurements," Measurement, vol. 143, pp. 125-135, 2019. View Article
[54] A. I. Sharaf and E. F. Radwan, "An automated approach for developing a convolutional neural network using a modified firefly algorithm for image classification," in Applications of Firefly Algorithm and its VariantsAnonymous Springer, 2020, pp. 99-118.View Article
[55] I. Strumberger , Eva Tuba, Nebojsa Bacanin, Miodrag Zivkovic, Marko Beko, and Milan Tuba, "Designing convolutional neural network architecture by the firefly algorithm," in Proceedings of the 2019 International Young Engineers Forum (YEF-ECE), Costa Da Caparica, Portugal, 2019, pp. 59-65.View Article
[56] Wu, Yunan, Feng Yang, Ying Liu, Xuefan Zha, and Shaofeng Yuan., "A comparison of 1-D and 2-D deep convolutional neural networks in ECG classification," arXiv Preprint arXiv:1810.07088, 2018.
[57] T. Ince , Serkan Kiranyaz, Levent Eren, Murat Askar, and Moncef Gabbouj, "Real-time motor fault detection by 1-D convolutional neural networks," IEEE Trans. Ind. Electron., vol. 63, (11), pp. 7067-7075, 2016. View Article
[58] A. Y. Hannun , Pranav Rajpurkar, "Cardiologist-level arrhythmia detection and classification in ambulatory electrocardiograms using a deep neural network," Nat. Med., vol. 25, (1), pp. 65, 2019. View Article
[59] A. Graves, A. Mohamed and G. Hinton, "Speech recognition with deep recurrent neural networks," in 2013 IEEE International Conference on Acoustics, Speech and Signal Processing, 2013, pp. 6645-6649.View Article
[60] R. Bousseljot, D. Kreiseler and A. Schnabel, "Nutzung der EKG-Signaldatenbank CARDIODAT der PTB über das Internet," Biomedizinische Technik/Biomedical Engineering, vol. 40, (s1), pp. 317-318, 1995. View Article
[61] D. Ye, Z. Chen and S. Ma, "A novel and better fitness evaluation for rough set based minimum attribute reduction problem," Inf. Sci., vol. 222, pp. 413-423, 2013. View Article
[62] L. Jing , Ming Zhao, Pin Li, and Xiaoqiang Xu, "A convolutional neural network based feature learning and fault diagnosis method for the condition monitoring of gearbox," Measurement, vol. 111, pp. 1-10, 2017. View Article
[63] Yamashita, Rikiya, Mizuho Nishio, Richard Kinh Gian Do, and Kaori Togashi., "Convolutional neural networks: an overview and application in radiology," Insights into Imaging, vol. 9, (4), pp. 611-629, 2018. View Article
[64] Das, Banee Bandana, Pradeep Kumar, Debakanta Kar, Saswat Kumar Ram, Korra Sathya Babu, and Ramesh Kumar Mohapatra., "A spatio-temporal model for EEG-based person identification," Multimedia Tools Appl, vol. 78, (19), pp. 28157-28177, 2019. View Article
[65] S. Kiranyaz , Serkan, Adel Gastli, Lazhar Ben-Brahim, "Real-time fault detection and identification for MMC using 1-D convolutional neural networks," IEEE Trans. Ind. Electron., vol. 66, (11), pp. 8760-8771, 2018. View Article
[66] Zheng, Jianwei, Jianming Zhang, Sidy Danioko, Hai Yao, Hangyuan Guo, and Cyril Rakovski., "A 12-lead electrocardiogram database for arrhythmia research covering more than 10,000 patients," Scientific Data, vol. 7, (1), pp. 1-8, 2020. View Article
[67] S. H. Jambukia, V. K. Dabhi and H. B. Prajapati, "Classification of ECG signals using machine learning techniques: A survey," in 2015 International Conference on Advances in Computer Engineering and Applications, 2015, pp. 714-721.View Article
[68] Martin, Thomas N., Bjoern A. Groenning, Heather M. Murray, Tracey Steedman, John E. Foster, Alex T. Elliot, Henry J. Dargie, Ronald H. Selvester, Olle Pahlm, and Galen S. Wagner., "ST-segment deviation analysis of the admission 12-lead electrocardiogram as an aid to early diagnosis of acute myocardial infarction with a cardiac magnetic resonance imaging gold standard," J. Am. Coll. Cardiol., vol. 50, (11), pp. 1021-1028, 2007. View Article
[69] R. O. Duda, P. E. Hart and D. G. Stork, Pattern Classification. John Wiley & Sons, 2012.