Journal of Biomedical Engineering and Biosciences (JBEB)
ISSN: 2564-4998

Volume 6 - Year 2019 - Pages 1-8
DOI: 10.11159/jbeb.2019.001
Computational Fluid Dynamics and Functional Imaging in the Evaluation of Mandibular Advancement Device Positioning
Adela Martínez1, Alfonso López Muñiz1, Eduardo Soudah2, 3, Juan Calvo4,
Alberto Álvarez Suárez5-7, Teresa Cobo6, 7
1Departamento de Morfología y Biología Celular, Universidad de Oviedo
Asturias, Spain
UO166895@uniovi.es; almu@uniovi.es
2Centre Internacional de Mètodes Numèrics en Enginyeria. Biomedical Engineering Department
Universidad Politécnica de Cataluña
C/ Gran Capità, s/n, 08034 Barcelona, Spain
esoudah@cimne.upc.edu
3Departamento de Resistencia de Materiales y Estructuras en la Ingeniería
Universidad Politécnica de Cataluña
Barcelona, C/ Jordi Girona, 1-3, 08034, Barcelona, Spain
esoudah@cimne.upc.edu
4Department of Radiology, Hospital Universitario Central de Asturias
Oviedo, Asturias, Spain
calvojuan@uniovi.es
5Department of Mechanical Engineering. Escuela Politécnica Superior de Ingeniería, Universidad de Oviedo
Asturias, Spain
suarez@uniovi.es
6Departamento de Cirugía y Especialidades Médico-Quirúrgica, Universidad de Oviedo
Asturias, Spain
teresacobo@uniovi.es
7Instituto Asturiano de Odontología
C/ Julián Clavería 6, 33006, Oviedo, Asturias, Spain
teresacobo@uniovi.es
Abstract - Mandibular Advancement Devices (MAD) have emerged as an accepted substitute of continuous positive airway pressure for the treatment of mild to moderate sleep apnea-hypopnea syndrome (SAHS). These devices bring the mandible forward and back enlarging the upper airway(s) area avoiding its collapsibility. However, to determine the mechanism of MAD positioning is relatively complex and remains a clinical challenge. If the MAD is not adjusted/titrated correctly, it may not have the desired results, and consequently, a reduced treatment response. Therefore, it is of great interest and importance to provide further data/evidence to the clinician by assessing the characteristics of the clinical response of the MAD titration. In this research, we combine computed tomography images and computational fluid dynamics to understand that the effects that the use of MAD has on the upper airway (UA). To achieve this, 10 patients suffering mild-to-moderate apnea were analyzed using MAD in two different scenarios (mandibular antepulsion and open mouth). The purpose of this study is to determine differences in effectiveness between two positioning of the same mandibular advancement device. For both scenarios the total volume, cross-sectional areas, velocities and pressure of the upper airways were studied and compared with the rest position (without MAD). The methodology used in this study may prove valuable in predicting which SAHS patients will benefit from treatment with oral appliances like MAD and may be also used as a potential clinical procedure to understand its titration and use.
Keywords: Computational Fluid Dynamics (CFD), sleep apnea, mandibular advancement Device (MAD).
© Copyright 2019 Authors This is an Open Access article published under the Creative Commons Attribution License terms. Unrestricted use, distribution, and reproduction in any medium are permitted, provided the original work is properly cited.
Date Received: 2018-10-31
Date Accepted: 2019-03-27
Date Published: 2019-11-25
1. Introduction
Sleep apnea is a sleep disorder caused by to abnormal pauses and/or reduction in breathing activity during sleep. Sleep apnea-hypopnea syndrome (SAHS) is the most common form of this disorder with a percentage of 84% of cases [1]. Usually, the SAHS is provoked by the relaxing of the muscle tone of the collapsible walls of soft tissue at pharyngeal level. This collapsibility of the muscular walls provokes a narrowing of the upper airways (UA), and consequently, a reduction in oxygenation. This reduced oxygenation causes hypoxemia and it can provoke the patient to have neurological and cardiovascular signs and symptoms such as a slower reaction time, reduced concentration ability, daytime fatigue, hypertension, atherosclerosis, changes in behaviour like irascibility, belligerence, moodiness or depression [2,3]. In some cases, the severity of SAHS may lead to stroke and even heart failure, resulting in an increased prevalence of cardiovascular morbidity and mortality [4]. Alcohol, sedatives and medicines that induce the relaxation of the pharyngeal muscles can increase the chances of airway collapse during the sleep. Therefore, the anatomy of the upper airway (UA) and the fluid-dynamics inside it have the biggest role in the SAHS. For moderate or severe sleep apnea, the most common treatment is the use of a continuous positive airway pressure (CPAP) device [20]. CPAP therapy has been proved to be much more effective than other treatments in improving sleep disorders, but some patients find it extremely uncomfortable or do not tolerate CPAP [5]. For this reason, nowadays orthodontists specializing in sleep disorders tend to prescribe a new oral appliance patient-specific therapy based on a rapid maxillary expansion treatment using a Mandibular Advancement Device (MAD) [6] [5] [21]. MAD is a custom-made mouthpiece that can shift the lower jaw forward/back allowing an opening up of the UA and nasal width, thus decreasing the resistance of nasal airflow. It has been known that the movement of the jaw increase the cross-sectional and volume of the UA in subjects with and without SAHS. However, if the opening of the jaw is excessive, the desired results may not be achieved.
In recent years, UA imaging and Computational Fluid Dynamics (CFD) studies have been applied to understand the biomechanical interactions between the jaw, tongue, soft palate and lateral pharyngeal walls and the flow and pressure fields in the UA. Computational fluid dynamics studies have been applied to model the flow field and pressure drop in the UA in SAHS using patient specific geometrical models obtained from medical imaging. These studies have allowed the understanding of the flow characteristics in the UA after a pharyngeal surgery [9] [16] [10] [14] and to determinate treatment response using MAD [15] [12] [13]. In [15] [13] studies combining CFD and medical imaging found a strong correlation between change in airway resistance with and without MAD.
Ten SAHS patients were studied in three different scenarios. For each subject/scenario, a rigid geometry model was obtained from three-dimensional computed tomography (CT) image data, transformed into three-dimensional computational model (computational mesh) and analyzed through CFD. For each subject/scenario the total UA volume and pressure were analyzed. The present work aims to contribute towards the importance of MAD’s influence in the UA physiology using CFD and medical images.
2. Materials and Methods
2.1. Participants and Setting
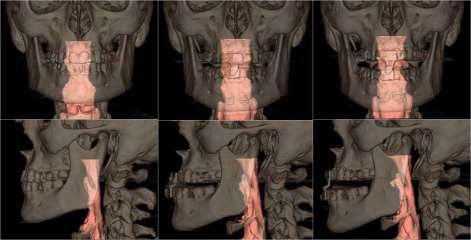
A total of 10 patients with mild-to-moderate sleep apnea–hypopnea index (AHI) <30 h-1 were recruited to participate in this study. The average age of the 10 patients was 50 years ±16 (means ± standard deviation), and their average body mass index (BMI ± kg/m2) was 26.1 ± 3.0. All the patients were volunteers and provided written informed consent for this study. This research was reviewed and approved by the Ethics Committee of the Medical University School of Medical and Dental Hospital, Oviedo, Spain. For each patient, 3 different scenarios have been recreated (figure 1): without MAD (S1: control group) and with MAD in two different positions (S2: mandibular antepulsion and S3: open mouth) (figure 1), obtaining a total of 30 different situations.
2.2. Upper Airway Modelling, CT Scan and Meshing
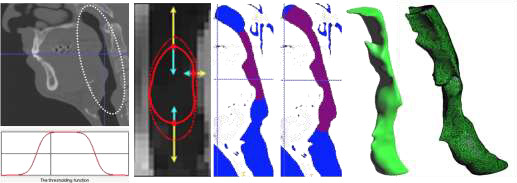
For the medical image acquisition, a Multidetector Helicoidal Computed Tomography (MDCT) Toshiba Aquilion 64 (Toshiba Medical Systems, Japan) was used with the following parameters: 512x512x491, pixel spacing: 0.468/0.468 with a resolution of 2.137 pixels per mm. Scanning was conducted, while the volunteer was awake, in the head first-supine position at the end of expiration. The data was stored in digital imaging and communications in medicine format (DICOM format). The region of interest (ROI) was segmented using the three-dimensional computer-aided design system ITK-SNAP software [7]. The segmented area started at the pharynx (approximately first cervical vertebra) and extended down to the larynx (fourth cervical vertebra). The upper-airway images (pharynx to larynx) were segmented from DICOM images combining two different segmentation procedures: thresholding and the level set methods. After upper airway segmentation, a 3D volume image is obtained, which is useful to create a 3D computational model to analyze the flow behavior inside the upper airway using computational fluid dynamics (CFD). To ensure the accuracy of the UA simulations, the numerical results will not be affected by changing the size element, a mesh sensibility analysis was performed previously for three independent cases (without MAA, with MAA in mandibular antepulsion, and open mouth situations). The 3D volume meshes obtained were around 1.600.000 +/- 10% tetrahedral elements depending on the complexity of the upper airway model.
For the 30 acquisitions, the same medical image protocol, image processing and volume mesh technique were used. Figure 2 shows the upper airway workflow process, from medical image to the 3D computational model.
2.3. Computational Fluid Dynamics
CFD analysis was performed using Tdyn [8]. Tdyn is an environment for computational fluid-dynamics, multi-physics simulation, and fluid-structure interaction calculations, based on the leading stabilized finite element method (FIC-FEM). Based on [10] [11] [17] [18] [20][22] we decided to use a Reynolds-Averaged Navier-Stokes (RANS) k-w model. These works show that the k–ω model is appropriate for upper airway flows and can accurate predict pressure drops and velocity profiles. Flow was assumed to be homogeneous, incompressible, adiabatic and Newtonian. The assumption of incompressible flow is justified since the velocities achieved are small compared with the speed of sound in air which corresponds to a low Mach number. A velocity profile was settled at the upper part of the velopharynx (inlet).The velocity input waveform alters in a sine wave (U=Uisin(2π·f·t)), which corresponds to transient respiration mode in a breathing period at the inlet of the upper airway was used. A frequency (f) of 0.2667 Hz was adopted, (period 3,75 seconds), which is the correspondent to the common breathing human frequency. The velocity U was calculated to obtain the same total tidal volume of 500mL for the entire breathing cycle of inspiration/expiration for each patient and scenario [20]. We consider that the oropharyngeal isthmus was closed, all the air flow is coming from the nasal cavities. A no-slip condition (pharynx rigid model wall) was imposed on the surface of the UA (i.e., the velocity on the wall was zero). This choice is motivated by the fact that the physiological parameters characterizing the mechanical behaviour (muscular tone) of the UA wall are not well determinate. The outlet boundary condition was settled to 0 atm of fix pressure at the larynx. The exact the same boundary conditions were applied for all the situations.
3. Results
For the three scenarios the UA total volume, crosssectional areas and pressure values were studied and compared. Pressure are obtained at any point of the fluid domain.
3.1. UA Total Volume
The data are tested for normality by using the Shapiro–Wilk W test. It is found that UA total volume for each scenario are normally distributed (S1 (W=0.90), S2 (W=0.90) and S3 (W=0.96)). The null-hypothesis of Shapiro-Wilk test is that the population is normally distributed, and if W is close to 1, then the null-hypothesis cannot be rejected. The Shapiro-Wilk test is a statistical test to check the normality for a small data set, as it is in our study (10 patients for scenario). Having checked the normality distribution, we can compute the Pearson correlation coefficient (PCC). The PCC is a measure of the linear correlation between two datasets, in our case we correlate the total UA volume between S1 and S2 scenarios and between S1 and S3 scenarios obtaining the following values 0.20 and 0.28 respectively. Those values indicate a positive linear correlation of the UA volume between S1 and S2/S3 scenarios, which means that the volume increase for S2 and S3 scenarios. The statistical analysis was performed using the Python libraries, SciPy and Seaborn [19] with a significance level of 0.05.
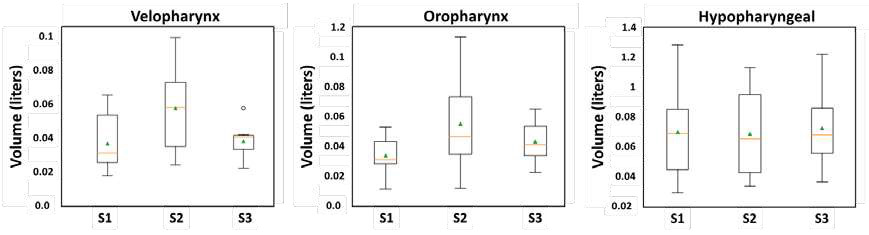
After checking that the MAD device increases the total UA volume, and with the objective to analyze how it affects the airway anatomy, the full domain was divided in three different domains: velopharynx, oropharynx and hypopharyngeal. For each scenario/domain the volume and the aspect ratio were calculated. For the velopharynx domain the S2 and S3 mean values increases against to S1, the mean UA volume aspect ratio obtained was S2/S1 = 2.01 and S3/S1 = 1.20. For the oropharynx and hypopharyngeal domains, the mean values also increase on a smaller scale, for the oropharynx domain the mean UA volume aspect ratio was S2/S1 = 1.95 and S3/S1 = 1.35; and for the hypopharyngeal domain was S2/S1 = 1.04 and S3/S1 = 1.10. These results suggest that the MAD in S2 and S3 configurations increase the UA total volume in the velopharynx, where usually the clinical surgical of SAHS are performed. It seems that scenario S2 increase higher the total volume in the velopharynx than S3 scenario.
3.2. Pressure and Area Cross Sectional Values
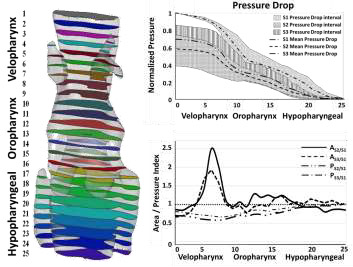
The general behaviour observed for all scenarios was that an abrupt pressure drop, and flow acceleration occur in bottom areas of the velopharynx domain (or top areas of the oropharynx), where the narrowest areas is. Usually patients with SAHS have a velopharyngeal constriction and that increased the influence of the velopharynx on the total pressure drop across the pharynx. Downstream of velopharynx domain the velocity decelerated, and pressure keeps more stable. The pressure and velocity of airflow in the oropharynx and hypopharynx were relatively constant. After MAD implantations (S2 and S3 scenarios), the pressure drop is less abrupt and flow decelerated significantly in the bottom areas of the velopharynx. With the objective to compare the MAD performance the mean pressure drop and the area have been analysed into a 25 cross-sectional planes along the pharynx (figure 4). Sections 1 to 8 correspond to the velopharynx domain, sections 9 to 16 correspond to oropharynx domain, and sections 17 to 25 correspond to hypopharyngeal domain. A mean accumulated pressure drop (PS2/S1 and PS3/S1) and mean accumulated area indexes (AS2/S1 and AS3/S1) have been defined for each i-cross sectional plane. The pressure and area indexes indicate the accumulated pressure drop and the mean area gain or loss of the i-cross sectional plane considering scenario S1 as a reference. Thanks to these indicators, we can correlate the area and the mean pressure drop values with and without MAD for each cross sectional plane along the pharynx.
3.2.1. Area Index
The area indexes ![]() and
and ![]() are calculated following these equations:
are calculated following these equations:


where
![]() and
and
![]() are the mean area value of i-cross sectional plane of scenario S2 or S3 against scenario S1 for the 25 different sections of the 10 patients analysed.
are the mean area value of i-cross sectional plane of scenario S2 or S3 against scenario S1 for the 25 different sections of the 10 patients analysed.
![]() ,
,
![]() and
and
![]() are the i-cross sectional area for the j-subject of scenarios S1, S2 and S3, respectively, j is number of the patient (total patient number, 10) and i is the number of the cross-sectional planes of the UA (total cross sectional planes, 25).
are the i-cross sectional area for the j-subject of scenarios S1, S2 and S3, respectively, j is number of the patient (total patient number, 10) and i is the number of the cross-sectional planes of the UA (total cross sectional planes, 25).
![]() ,
,
![]() and
and
![]() are obtained directly from the 3D segmentation image.
are obtained directly from the 3D segmentation image.
![]() and
and
![]() indexes indicate the mean area gain (area index > 1) or loss (area index < 1) for the scenarios S2 and S3 (with MAD) related to scenario S1 (without MAD) (Figure 4). Figure 4 suggests that the MAD increases the total i-cross sectional areas for S2 and S3 scenarios, and particularly in the velopharynx domain, areas candidate to the collapsibility. In S2 configuration the mean area increment for the 10 patients is approximately 2.5 more, and in S3 the 2. In the hypopharyngeal and in the oropharynx areas there are minimal changes.
indexes indicate the mean area gain (area index > 1) or loss (area index < 1) for the scenarios S2 and S3 (with MAD) related to scenario S1 (without MAD) (Figure 4). Figure 4 suggests that the MAD increases the total i-cross sectional areas for S2 and S3 scenarios, and particularly in the velopharynx domain, areas candidate to the collapsibility. In S2 configuration the mean area increment for the 10 patients is approximately 2.5 more, and in S3 the 2. In the hypopharyngeal and in the oropharynx areas there are minimal changes.
3.2.2. Pressure Index
With the objective to understand how MAD positioning affect to the pressure distribution, we have defined a pressure drop band using the high and low pressure values taking as
S1 scenario as reference and we have calculated the mean accumulated pressure drop value of i-cross sectional plane of scenario S2 or S3 against scenario S1
(![]() and
and ![]() ) as:
) as:


where
![]() ,
,
![]() and
and
![]() are the i-cross sectional mean pressure for the j-patient of scenarios S1, S2 and S3, respectively. j is number of the patient
(total j-patient number, 10) and i is the number of the cross-sectional planes of the UA (total i-cross sectional planes, 25).
are the i-cross sectional mean pressure for the j-patient of scenarios S1, S2 and S3, respectively. j is number of the patient
(total j-patient number, 10) and i is the number of the cross-sectional planes of the UA (total i-cross sectional planes, 25).
![]() ,
,
![]() and
and
![]() values are calculated as:
values are calculated as:


where
![]() is the area of the i-cross sectional plane, and Pi is the pressure measured at each point of the i-cross sectional plane obtained from the CFD.
is the area of the i-cross sectional plane, and Pi is the pressure measured at each point of the i-cross sectional plane obtained from the CFD.
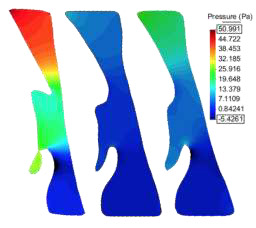
The pressure drops gradually just before bottom of the velopharynx, where an abrupt pressure change occurs, then the pressure drops again gradually toward the lower oropharynx and hypopharyngeal. We observed that for both configurations the pressure drop decreases, and even there is a common area between S2 and S3 configurations, the mean pressure band indicates that the pressure drop is less abrupt in scenarios S2. Scenario S2 prompts a more uniform pressure distribution avoiding huge pressure changes along the pharynx. This reduction of the pressure drop indicates an improvement in breathing, avoiding apnea episodes. Physiologically, scenario S2 (close mouth or mandibular antepulsion) induces better performance of MAD. For both scenarios (S2 and S3), less pressure difference is required to produce the same tidal volume, implying that the resistance of the airway decreased and less breathing effort is required. Next figure (Figure 5) shows the pressure distribution in the three scenarios for the same patient using a fixed pressure scale. For the pressure scale, we have used the maximum and minimum pressures reached in S1 scenario. The pressure profiles for S1 scenario is characterized by one or two pressure drops, one in the bottom area of the velopharynx and one in the top area of the hypopharynx, whereas for the S2 and S3 scenarios, the pressure profiles were characterized by only one main pressure drop in the bottom area of the velopharynx.
4. Conclusion
This study helps us investigate the influence of an oral appliance like MAD in the treatment for SAHS combining functional medical image and CFD techniques. The image processing techniques allow us to obtain the geometrical model of the UA for the three scenarios and prove how a MAD induces changes in the structure of the upper airway. It is well known that high pressures in the UA provoke apnoea episodes, therefore decreasing the pressure drop will avoid those episodes, improving breathing and oxygenation during sleep. The most critical area in the UA is the velopharynx area. This restricted area directly induces a jet flow increasing the air velocity and pressure drop. Analyzing the results, we observe that when using a MAD, the volume increases considerably in the areas where the collapsibility is higher (velopharynx). The CFD analysis also shows the fluid characteristics in the UA are altered toward a shape that is less prone to collapse, the pressure decreases in the whole domain when MAD is used, (one of the desired effects). And even if, the pressure drop decreases in both positions, close mouth appears be more effective than open mouth. In order to quantify these effects, we have defined four indicators: two pressure indicators PS2/S1 and PS3/S1 and two area indicators AS2/S1 and AS3/S1. In this study, the UA models have been generated and analysed in the same manner and the normality was checked. To corroborate this preliminary conclusion, close mouth works better than open mouth, a larger cohort of patients would be needed.
Although we found a strong correlation in our data with MAD treatment outcome, there are some limitations to the work. The complexity of the problem is of such magnitude that some simplifications in the modelling approach had to be adopted. The effect of the compliance of the pharynx wall has not been considered, due to the non-possibility to measure the external pressure induced/triggered by the muscular tone and the wall properties of the UA for each patient during sleep. These simplifications were adopted to reduce the complexity of the problem, since our main focus was to study the anatomical and physiological changes induced by using MAD treatment in different scenarios. Future research will consider the interaction with the pharynx wall to simulate how the walls are attracted towards where velocity is concentrated, as well as, take into account the external pressure. However, we believe our initial findings to be encouraging for a potential clinical methodology for SAHS treatment, and therefore an attractive method to model a likely treatment outcome with MAD in patient-specific airway geometry before the final implementation of the device.
Conflict of Interest
This manuscript has been prepared according to all ethical and scientific guidelines. No conflict of interest existed during the course of this study and the preparation of the manuscript.
Acknowledgements
This work was supported by Instituto Asturiano de Odontología.
Best Paper award at ICBES'18 in Madrid, Spain.
References
[1] T. I. Morgenthaler, V. Kagramanov, V. Hanak, P. A. Decker, "Complex sleep apnea syndrome: is it a unique clinical syndrome?” Sleep, vol. 29, no. 9, pp. 1203–9, 2006. View Article
[2] B. El-Ad and P. Lavie, “Effect of sleep apnea on cognition and mood,” International Review of Psychiatry, vol. 17, no. 4, pp. 277-282, 2005. View Article
[3] M. S. Aloia, L. H. Sweet, B. A. Jerskey, M. Zimmerman, J. T. Arnedt, R. P. Millman, “Treatment effects on brain activity during a working memory task in obstructive sleep apnea,” Journal of Sleep Research, vol. 18, no. 4, pp. 404-410, 2009.View Article
[4] W. De Backer, Obstructive Sleep Apnea Syndrome. Karger, Basel, pp. 90–96. 2006. View Article
[5] W. J. Randerath, J. Verbraecken, S. Andreas, G. Betteg, A. Boudewyns, E. Hamans, F. Jalbert, J. R. Paoli, B. Sanner, I. Smith, B. A. Stuck, L. Lacassagne, M. Marklund, J. T. Maurer, J. L. Pepin, A. Valipour, T. Verse, I. Fietze, “Non-CPAP therapies in obstructive sleep apnoea,” European Respiratory Journal, vol. 37, pp. 1000-1028, 2011. View Article
[6] J. Lim, T. J. Lasserson, J. Fleetham, J. Wright, “Oral appliances for obstructive sleep apnoea,” Cochrane Database of Systematic Review, 2006.View Article
[7] ITK-SNAP. (2018, March 25). [Online]. Available: www.itksnap.orgView Article
[8] TDYN: theoretical Background: www.compassis.com/compassis. 2018.View Article
[9] M. Z. Lu, Y. Liu, J. Y. Ye, H. Y. Luo, “Large Eddy Simulation of Flow in Realistic Human Upper Airways with Obstructive Sleep,” Procedia Computer Science, vol. 29, pp. 557-564, 2014. View Article
[10] M. Mihaescu, G. Mylavarapu, E. J. Gutmark, N. B. Powell NB, “Large eddy simulation of the pharyngeal airflow associated with obstructive sleep apnea syndrome at pre and post-surgical treatment,” Journal of Biomechanics, vol. 44, no. 12, pp. 2221-8, 2011. View Article
[11] Goutham Mylavarapu, Shanmugam Murugappan, Mihai Mihaescu, Maninder Kalra, Sid Khosla, Ephraim Gutmark, “Validation of computational fluid dynamics methodology used for human upper airway flow simulations,” Journal of Biomechanics, vol. 42, no. 10, pp. 1553-1559, 2009. View Article
[12] E. Soudah, M. Bordone, A. Alvarez, J. Cobo, F. A. De Carlos and B. Suarez, “Comportamiento de los dispositivos mandibulares en el tratamiento de la apnea del sueño,” Revista Internacional de Métodos Numéricos para Cálculo y Diseño en Ingeniería, 2012. View Article
[13] Z. Moyin, T. Barber, P. Cistulli, K. Sutherland, & G. Rosengarten, “Computational fluid dynamics for the assessment of upper airway response to oral appliance treatment in obstructive sleep apnea,” Journal of Biomechanics, vol. 46, pp. 142–150, 2013. View Article
[14] Darshit H. Shah, Ki Beom Kim, Mark W. McQuilling, Reza Movahed, Ankit H. Shah, Yong I. Kim, “Computational fluid dynamics for the assessment of upper airway changes in skeletal Class III patients treated with mandibular setback surgery,” The Angle Orthodontist, vol. 86, no. 6, pp. 976-982, 2016. View Article
[15] Jan W. De Backer, Wim G. Vos, Stijn L. Verhulst, Wilfried De Backer, “Novel imaging techniques using computer methods for the evaluation of the upper airway in patients with sleep-disordered breathing: A comprehensive review,” Sleep Medicine Reviews, vol. 12, no. 6, pp. 437-447, 2008. View Article
[16] J. Huynh, K. B. Kim, M. McQuilling, “Pharyngeal airflow analysis in obstructive sleep apnea patients pre- and post-maxillomandibular advancement surgery,” Journal of Fluids Engineering, vol. 131, no. 9, pp. 91-101, 2009. View Article
[17] C. Kleinstreuer and Z. Zhang, “Laminar-to-turbulent fluid-particle flows in a human airway model,” International Journal of Multiphase Flow, vol. 26, pp. 271–289, 2003. View Article
[18] Z. Zhang and C. Kleinstreuer, “Low-Reynolds-number turbulent flows in locally constricted conduits: A comparison study,” American Institute of Aeronautics and Astronautics Journal, vol. 41, pp. 831–840, 2003. View Article
[19] E. Jones, E. Oliphant, P. Peterson, et al. (2018, March 25). SciPy: Open Source Scientific Tools for Python, 2001. [Online]. Available: http://www.scipy.org/ View Article
[20] G. Mylavarapu, S. Murugappan, M. Mihaescu, M. Kalra, S. Khosla, E. Gutmark, “Validation of computational fluid dynamics methodology used for human upper airway flow simulations,” Journal of Biomechanics, vol. 42, no. 10, pp. 1553–1559, 2009. View Article
[21] S. W. Knappe, L. Sonnesen, “Mandibular positioning techniques to improve sleep quality in patients with obstructive sleep apnea: current perspectives,” Nature and Science of Sleep, vol. 10, pp. 65-72, 2018. View Article
[22] Y. Liu, J. Mitchell, Y. Chen, W. Yim, W. Chu, R. C. Wang, “Study of the upper airway of obstructive sleep apnea patient using fluid structure interaction,” Respir.physiology & Neurobiology, vol. 249, pp. 54–61, 2018. View Article