Journal of Biomedical Engineering and Biosciences (JBEB)
ISSN: 2564-4998

Volume 10 - Year 2023 - Pages 10-19
DOI: 10.11159/jbeb.2023.003
Methods, Validation and Clinical Implementation of a Simulation Method of Cerebral Aneurysms
Jozsef Nagy1, Julia Maier2, Veronika Miron2, Wolfgang Fenz3, Zoltan Major2, Andreas Gruber4, Matthias Gmeiner4
1eulerian-solutions e.U.
Leonfeldnerstraße 245, Linz, Austria
jozsef.nagy@eulrian.solutions.com
2Johannes Kepler University Linz - Institute of Polymer Product Engineering
Altenberger Strasse 69, Linz, Austria
veronika.miron@jku.at; julia.maier@jku.at; zoltan.major@jku.at
3 RISC Software GmbH
Softwarepark 32a, Hagenberg, Austria
wolfgang.fenz@risc-software.at
4Johannes Kepler University Linz - Universitätsklinik für Neurochirurgie
Wagner-Jauregg-Weg 15, Linz, Austria
matthias.gmeiner@kepleruniklinikum.at; andreas.gruber_1@kepleruniklinikum.at
Abstract - The treatment of patients with cerebral aneurysms poses multiple challenges to physicians from rupture to treatment risk assessment and their consequences to the patient’s health. Risk estimation support is highly required to make the optimum decisions for individual patients. The aim of this study is to develop the workflow of a simulation method for the analysis of hemodynamics and structural mechanics of cerebral aneurysms as well as its possible clinical implementation.
Medical imaging data was taken and converted into CAD data (STL format) to use as geometric input for simulations. Fluid-Structure Interaction (FSI) simulations are utilized in the inflow vessel, the outflow vessels as well as a typical aneurysm. Aitken’s underrelaxation method is used to ensure convergence between hemodynamics and structural mechanics. The influence of linear and non-linear elastic material properties of the vessel wall as well as the influence of wall thickness reduction in the aneurysm sac are investigated.
In this work, two major hemodynamic (wall shear stress and oscillatory shear index) and two structural mechanic quantities (wall displacement and Mises stress) are evaluated and compared between the different models. The linear elastic material model tends to overestimate displacements at high strain rates. The reduction of wall thickness in the aneurysm region shows an increase in wall stresses. In both cases hemodynamic phenomena are not changed, however a tendency of aneurysm growth can be identified.
The model is implemented as part of a graphical user interface. With this, it is possible for medical personnel without simulation background to run sophisticated Fluid-Structure interaction simulations with ease and in future to make optimized decisions for patient treatment.
Keywords: Cerebral aneurysm, Hemodynamics, Structural mechanics, Fluid-structure interaction, Visualization.
© Copyright 2023 Authors This is an Open Access article published under the Creative Commons Attribution License terms. Unrestricted use, distribution, and reproduction in any medium are permitted, provided the original work is properly cited.
Date Received: 2023-08-01
Date Revised: 2023-09-08
Date Accepted: 2023-09-15
Date Published: 2023-10-03
1. Introduction
Cerebral aneurysms are occurring in about 2–5% of the overall population [1]. Rupture of aneurysms lead to subarachnoid hemorrhage (SAH), which is commonly associated with high mortality and morbidity. Several studies have demonstrated various well-known clinical, genetic, morphological or hemodynamic factors for initiation, growth and rupture of cerebral aneurysms [2,3,4].
An increase in the use of medical imaging has led to a larger number of detected unruptured aneurysms. This in turn leads to an increased need for treatment decisions. Only aneurysms close to rupture should be treated as the treatment itself contains many risks for the patient. Thus, reliable support for decision making is needed to better treat patients.
Recently, investigations using computational fluid dynamics (CFD) could demonstrate significantly different hemodynamics in ruptured versus unruptured aneurysms [5,6,7]. Hemodynamic phenomena provide mechanical triggers that are transduced into biological signals leading to possible aneurysm growth and rupture [8]. Hemodynamics are influenced by aneurysm geometry and thus morphological parameters [9].
Further, although many detailed fluid dynamics simulations including complex flow patterns have been performed [2,3,5,6,7,8,9,10], so far only a few studies have focused on structural dynamics calculations [11,12,13]. In our opinion, a comprehensive evaluation of individual hemodynamics should include analysis of fluid as well as structural aspects using fluid-structure interaction (FSI) analysis.
To model combined hemodynamics as well as structural mechanics, a reliable simulation workflow is developed and implemented into a simulation suite. This way in the future medical personnel can also set up, start, and evaluate simulations without extensive simulation background.
2. Methods
2. 1. Patient image data, simulation geometry and mesh
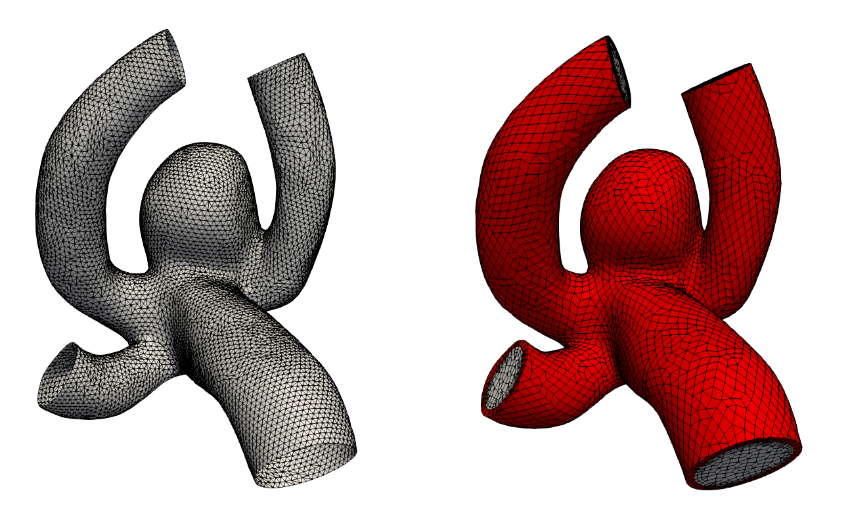
The aneurysm geometry is extracted from medical image data obtained via digital subtraction angiography (DSA). The segmentation of the cerebral aneurysm geometry is performed with intensity thresholding and minor editing of the voxel volume. The segmentation is converted into a surface mesh via the marching cubes algorithm. The centerline of the surface mesh is calculated and inlet as well as outlet planes are placed perpendicular to these lines. The final set of surfaces (parent vessel, aneurysm, inflow, outflows) is saved as triangulated surfaces in STL format (see figure 1 left). A sufficient resolution is guaranteed for the correct depiction of all geometric features.
The volumetric fluid mesh is automatically generated utilizing the STL files as input. A hex dominant grid is generated in order to avoid bad quality cells and numerical instabilities. The solid mesh is extruded from the fluid mesh with a certain pre-defined thickness resulting in a high quality grid. Figure 1 shows on the right-hand side a typical calculation mesh in the fluid (grey) and solid (red) region.
2. 2. Hemodynamic and structural mechanic modelling
An in-house finite volume solver based on the open-source computational fluid dynamics tool OpenFOAM [13] in combination with the fluid-structure interaction library solids4Foam [14] was used to numerically solve the unsteady equations of the process.
For hemodynamic modelling the governing equations are given by the principles of mass and momentum conservation with the help of the continuity equation as well as the Navier Stokes equations,
Here, ρ is the fluid density, t is the time, is the velocity vector, p is the fluid pressure, is the fluid stress tensor and F is the vector of possibly additional forces (e.g. gravitation). In order to analyse hemodynamic results, the oscillatory shear index is defined as
where, σW is the fluid wall shear stress (WSS) vector. The index is defined in the interval between [0;0.5] and gives the quantity of oscillatory behaviour of the wall shear stress on the fluid wall.
For structural mechanic modelling, the principle of force conservation is utilized. For linear elastic materials the equation is given by


Here, ρs is the solid density, us is the vector of displacement, n0 is the surface normal vector, σs is the solid stress tensor and b is the vector of possible body forces. E is Young’s modulus and ν is Poisson’s ratio. For non-linear elastic materials equation (3) turns into
F is the tensor of the deformation gradient and J is its Jacobian. The stress tensor σs for non-linear elastic materials is derived from the strain energy function [15]. For the investigated N=3 Ogden model the function is given by
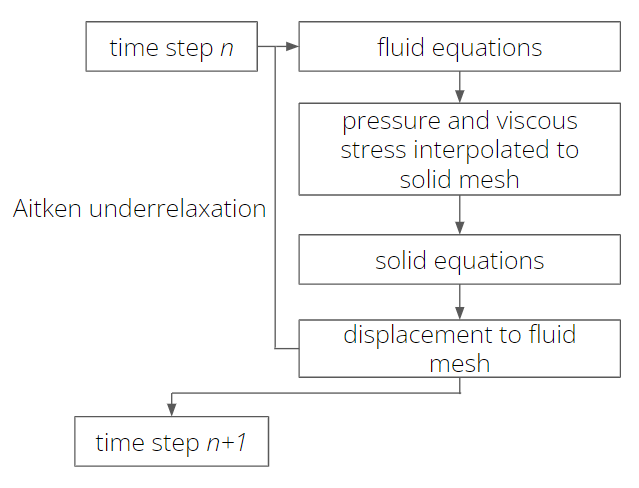
The solution workflow in Fluid-Structure interaction simulations is shown in figure 2 (a). Equations (1)-(9) are solved sequentially by first solving the fluid mechanic equations (1) and (2). Fluid pressure and the stress tensor are interpolated via the interaction surface from fluid to solid. These quantities are added to equations (3) or (8) as body forces. After solving the solid equations (3) or (8), the displacement of the solid is interpolated onto the fluid and the region is morphed accordingly. This workflow is iterated utilizing the Aitken [14] underrelaxation method to guarantee convergence within a time step.
A pulsatile flow condition in the form of a time-dependent velocity curve [16] is imposed as boundary condition for the fluid flow at the inflow surface, whereas experimental pressure data is taken from [17] in order to define a time dependent condition at the outflow surface. Along the walls no-slip conditions are assumed. Blood is modelled as a fluid with a viscosity of 0.04 Poise and a density of 1.06 g/cm3. One cardiac cycle [18] with a heart-beat rate of 60 beats per minute is calculated with 100 time-steps per cardiac cycle.
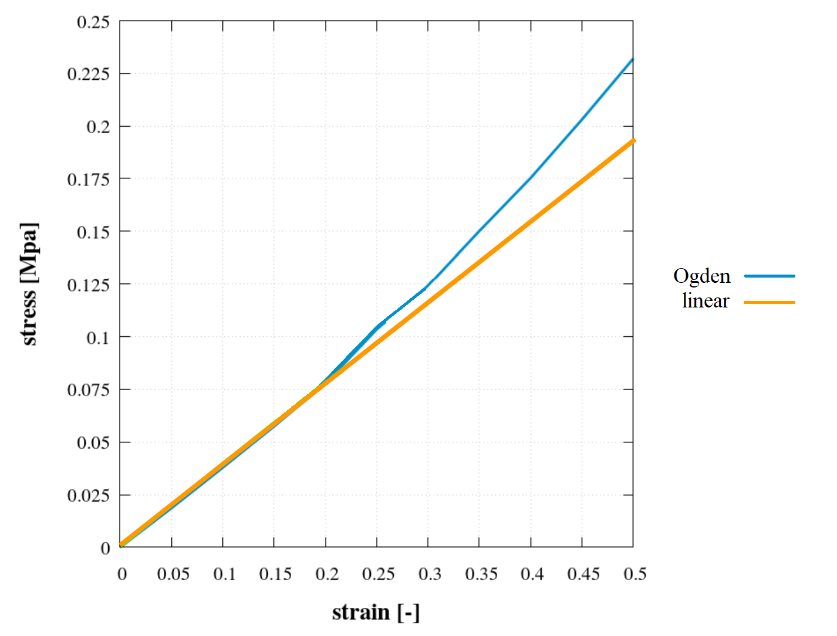
Solid mechanic boundary conditions are applied by fixing the vessel walls at the in- and outflow faces. The vessel wall is assumed to be either linear or nonlinear elastic. For linear elastic modelling, a Young’s modulus value of 24.9 MPa [18] and a Poisson’s ratio of 0.49 are utilized. These values are the maximum values in [18]. In the non-linear elastic simulations with the Ogden model constants are set to be µ1=0.65e6,µ2=µ3=0, and α1=4.84, α2= α3=1. Figure 2 (b) shows the strain-stress curve for the linear and non-linear elastic Ogden material model. A deviation between the curves above a strain of 0.2 can be clearly seen. As the fluid pressure (and with it the solid stresses) is prescribed in the solid iterations, at high stress values the strain (and displacement) is overestimated by the linear elastic model.
3. Model validation
To investigate the validity of simulation results the quality of results generated by presented models is compared to experimental results. Experiments are carried out with a custom-built setup as described below [19].
For the experimental validation the flow in two flexible geometries is considered and the wall strain is captured for comparison with the simulations. The two geometries are the following:
- Simple channel (see Figure 3 (a)) - wall thickness 0.5mm, length 80mm
- Channel with varying wall thickness (see Figure 3 (b)) – wall thickness 0.5mm/1 mm, length 80 mm, centered in the middle 4 cm long thinner section with wall thickness of 0.5 mm
3. 1. Experimental setup
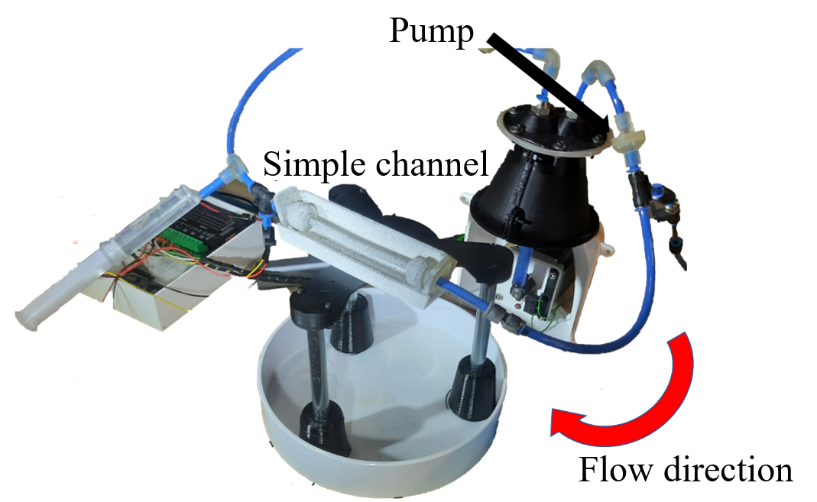
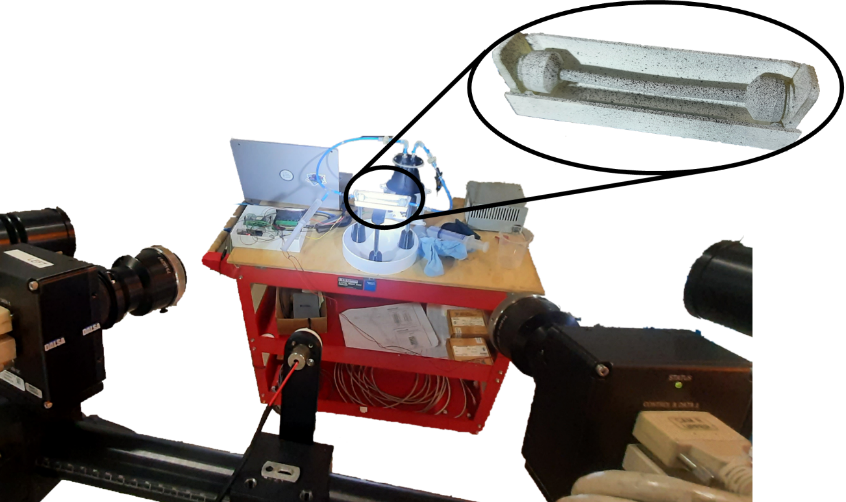
The flexible channels are manufactured with silicone casting out of a special material Dragon Skin 10 (Smooth-On, Macungie, USA). The moulds are created by material extrusion Fused Filament Fabrication (FFF) and material jetting (PolyJet). In the experiments, blood circulation is mimickedin a way, that water is circulated with the help of a pump controlled by a stepper motor (Figure 4 (a)). For this purpose, the flexible channels are clamped into the circuit with rigid channels to avoid additional displacement outside of the investigated geometries. The entire test setup is shown in Figure 4 (b).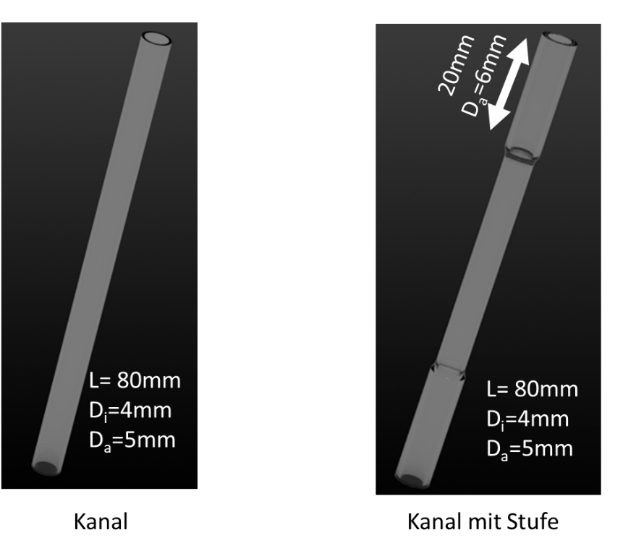
 (a)
(a)
 (b)
(b)
As the pump moves the water through the channels, the stepper motor predefines a certain pressure curve over time in the system. This way in the experiment different pressure dynamics and the impact on the flexible channels can be observed. The flexible channel is mimicking the flexible blood vessel around the aneurysm as well as the aneurysm itself in the human body under constant pressure changes in a heart cycle. The comparison of the strain in the channels between experiment and simulation gives an estimate of how well the simulation method can depict the dynamics in a real-life aneurysm.
For the determination of the strain of the flexible channels the Aramis System (GOM, Braunschweig, Germany) for Digital Image Correlation is used [19].
These geometries are subjected to two different pressure profiles over time in order to experimentally record the strain of the geometries with the camera system.
- Trapezoidal pressure curve
- Blood pressure curve from literature [17]
Pressure is measured directly at the exit of the flexible channels with a pressure sensor. This value of strain of the flexible channels is compared with th results in the simulation.
The Young’s modulus of the channels is defined with 350 kPa and a Poisson's ratio with 0.48 [19]. This material is softer than the maximum value used from [18], but is still between minimum and maximum values of Young’s modulus in [18]. Thus, this material is still applicable to mimic the behavior of blood vessels.
4. 2. Comparison experiment and simulation
Simulation and experimental results of the strain (see equation 5) are shown in figures 5 and 6. The green curves in Figure 5 indicate the measured pressure curves in the experiment (prescribed values from literature curve from [17]). There are slight differences in experiments due to inaccuracies in the experimental setup. The first pressure profile is used in the simulation as a pressure boundary condition. The two blue curves show the strain over time in the two experiments. In comparison, the orange curve of the simulation shows a good agreement in its time evolution, as it remains mostly in-between the two experimental curves.
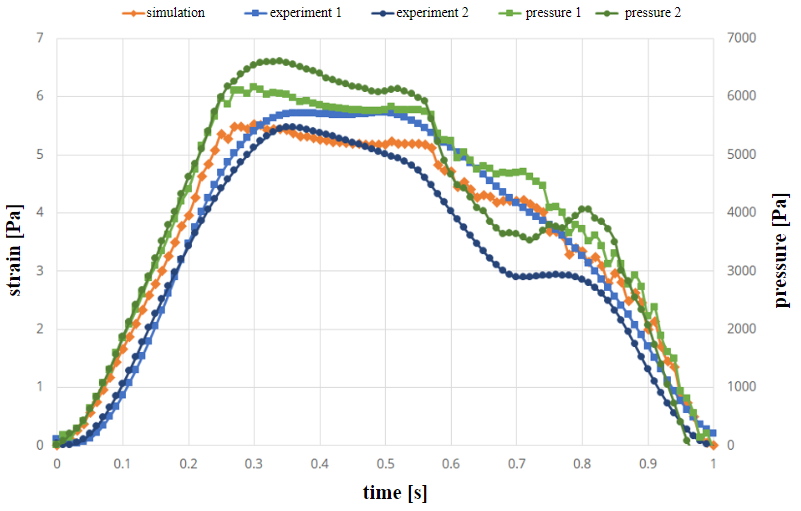
Figure 6 shows the strain and pressure curves the geometry with the varying wall thickness in case of a trapezoidal pressure curve. Also, in this case the first curve is used in the simulation. In this case, strain values are again in-between the experimental results and differences are mostly due to inaccuracies in the experiments. In some cases, differences in experiments vary significantly [19]. This is due to the fact, that there is a time delay in the experimental setup.
Tables 1 and 2 show the values of strain in the channels at the time of maximum pressure (not maximum strain). In all cases, simulation results are close to experiment 1 (pressure condition in simulation always taken from first experiment).
Table 1. Strain value in experiments and simulation at time of maximum pressure in the constant wall thickness channel.
|
pressure curve |
simulation [%] |
experiment 1 [%] |
experiment 2 [%] |
|
literature |
5.53 |
5.41 |
5.11 |
|
trapezoid |
6.10 |
5.70 |
4.90 |
These results shows that the difference between experiment and simulation is in the same order of magnitude as the difference between two experimental runs with the same prescribed pressure curves. Simulations can determine the movement of elastic channels with the same accuracy as the experimental setup.
This way the simulation model is adequate to model the fluid flow of soft and elastic tissues found in blood vessels in cerebral aneurysms.
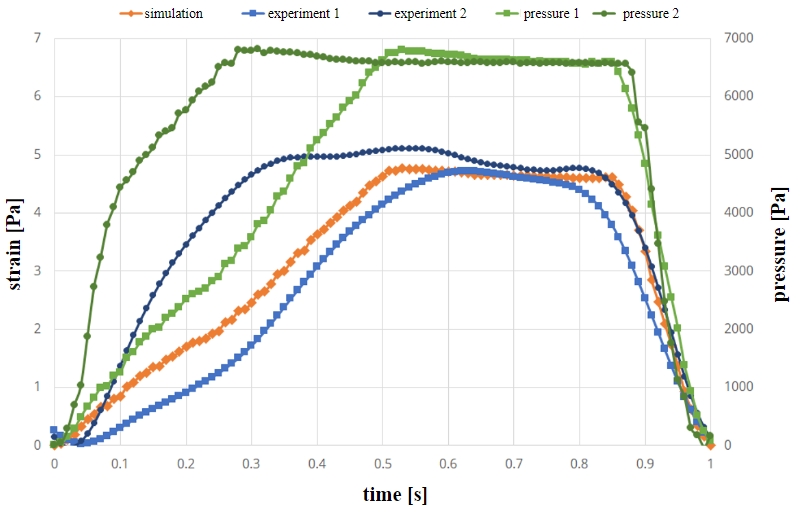
Table 2. Strain value in experiments and simulation at time of maximum pressure in the varying wall thickness channel.
|
pressure curve |
simulation [%] |
experiment 1 [%] |
experiment 2 [%] |
|
literature |
4.09 |
4.04 |
2.63 |
|
trapezoid |
4.77 |
4.37 |
4.51 |
4. Hemodynamic and structural mechanic behaviour
4. 1. Influence of linear and non-linear material model
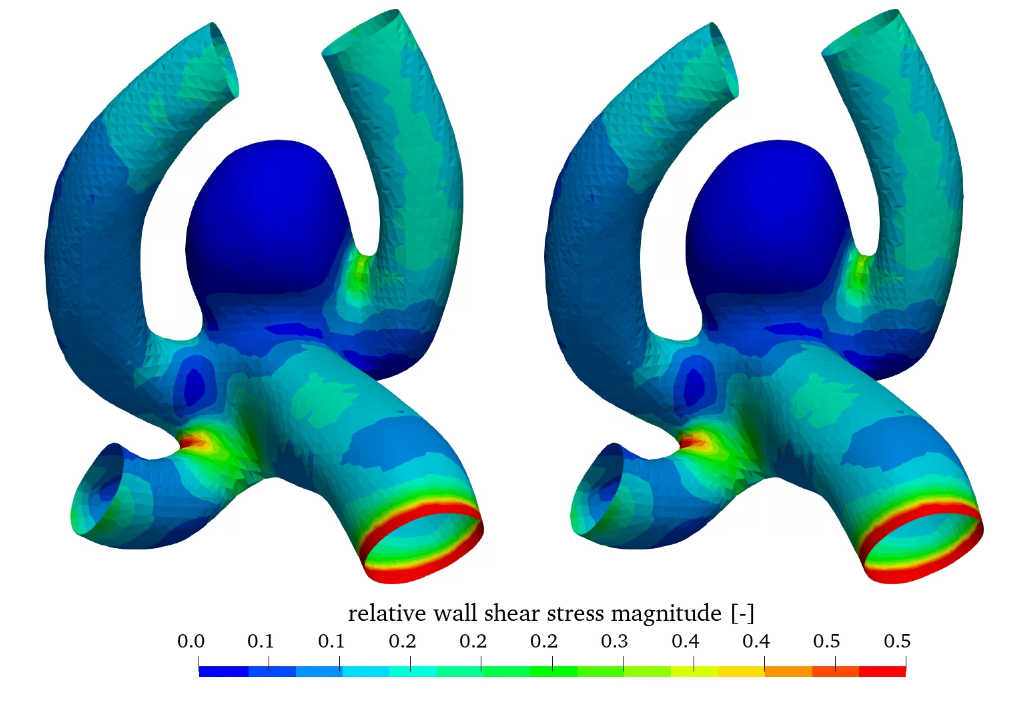
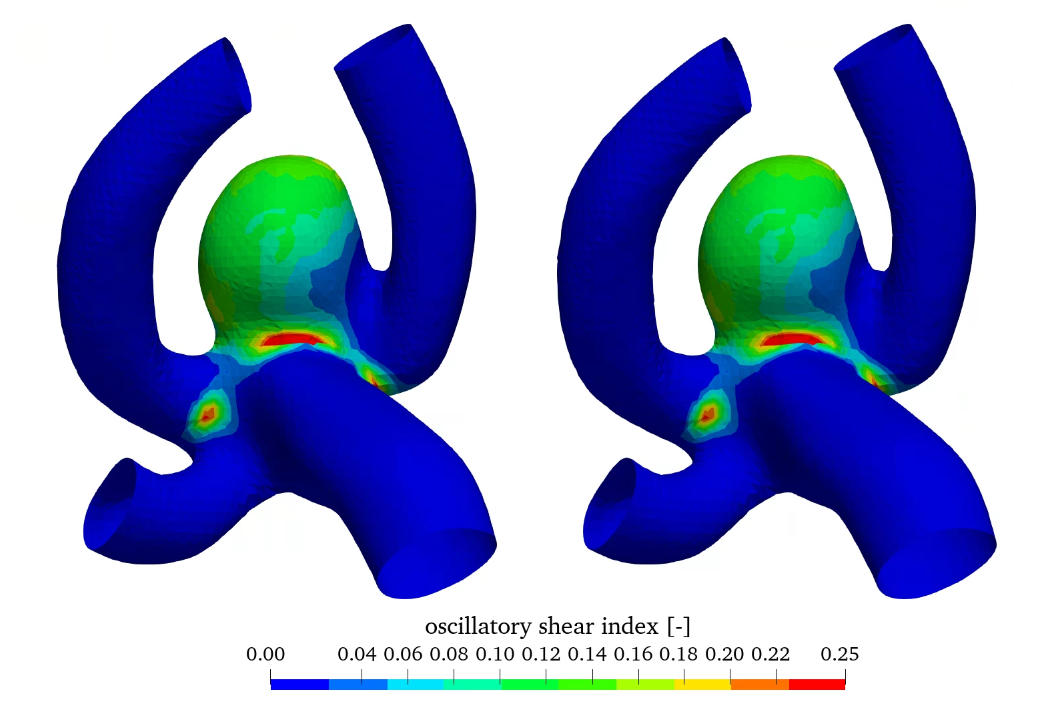
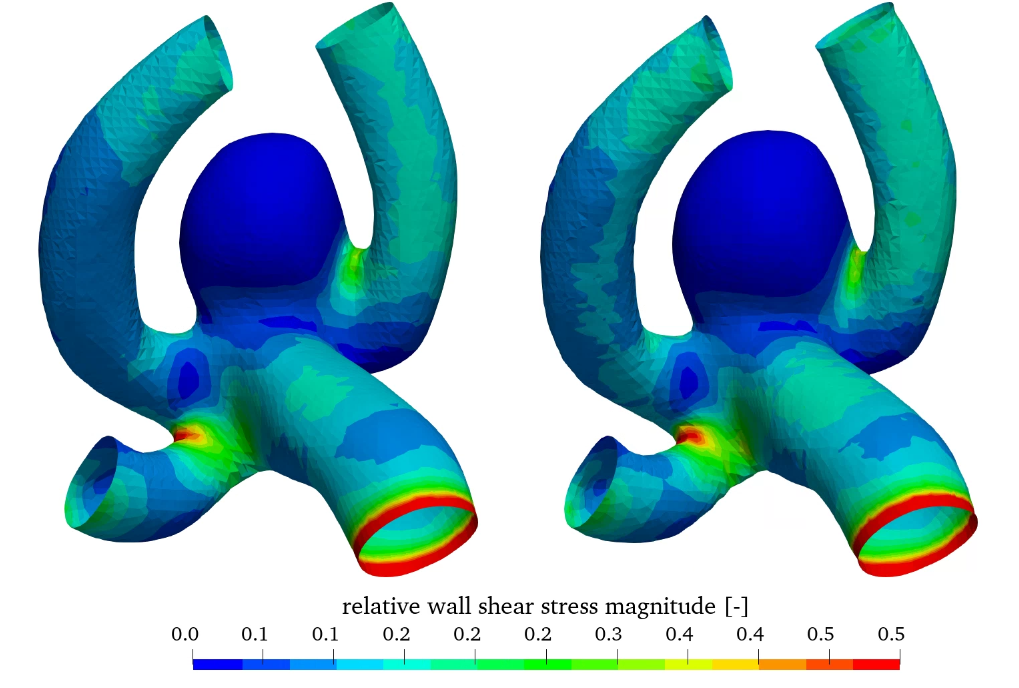
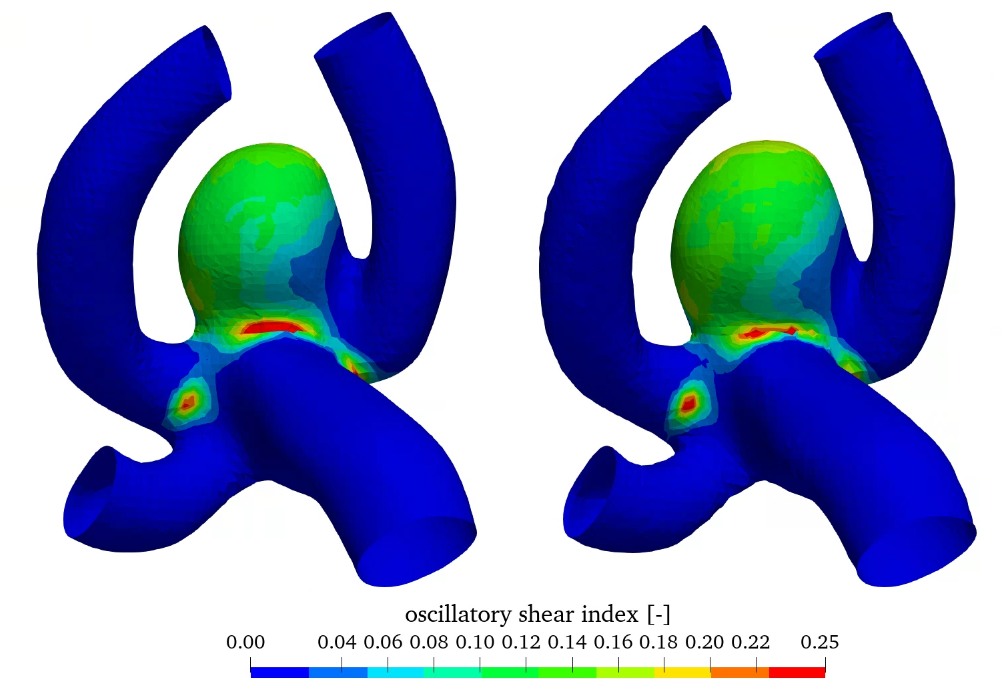
Figure 7 shows the relative wall shear stress (WSS scaled by the maximum value) as well as the oscillatory shear index (OSI) for the linear and non-linear elastic material models. WSS is high in the parent vessel and is low in the aneurysm.
In contrast OSI is high in the aneurysm, which may indicate aneurysm growth [8]. Comparing the linear and non-linear elastic simulations no significant difference can be seen in the hemodynamic quantities, as the difference is in the structural modelling.
 (a)
(a)
 (b)
(b)
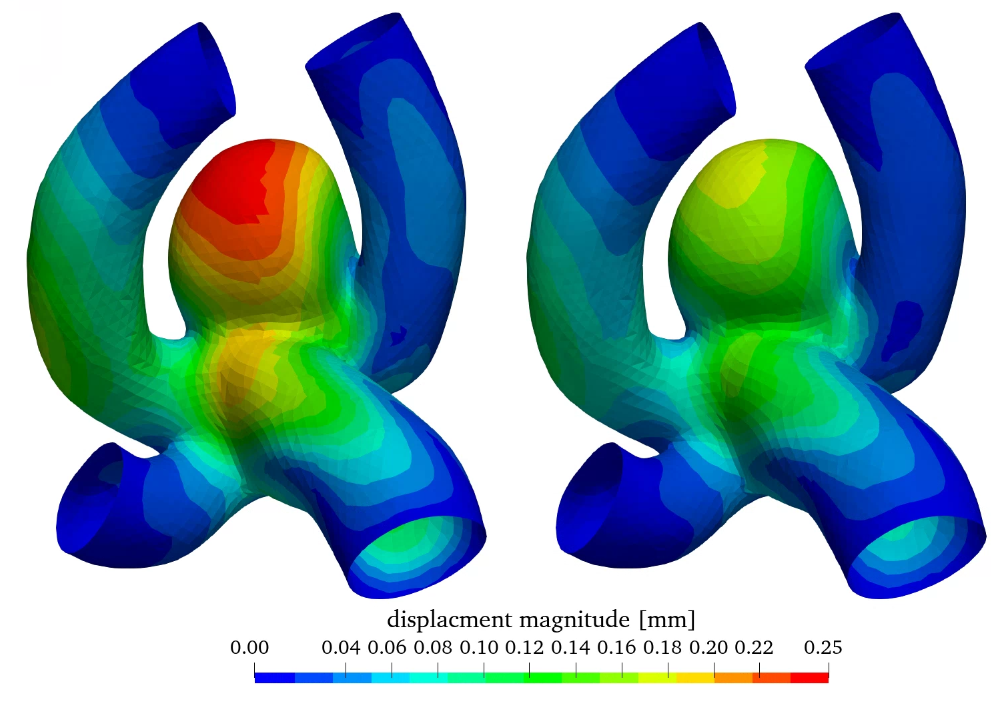
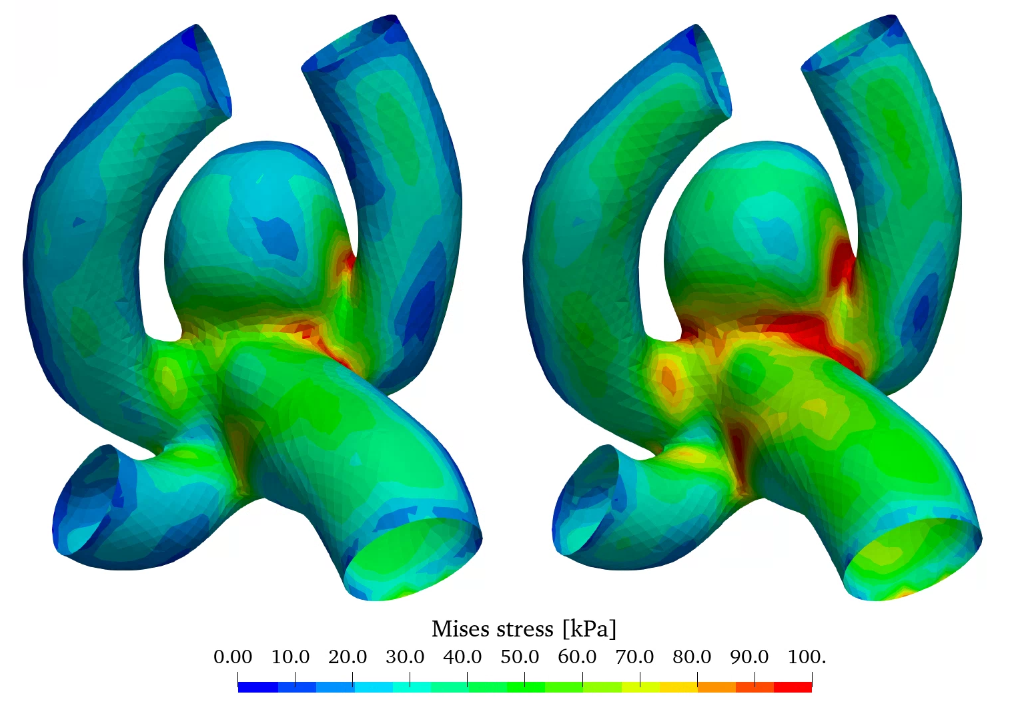
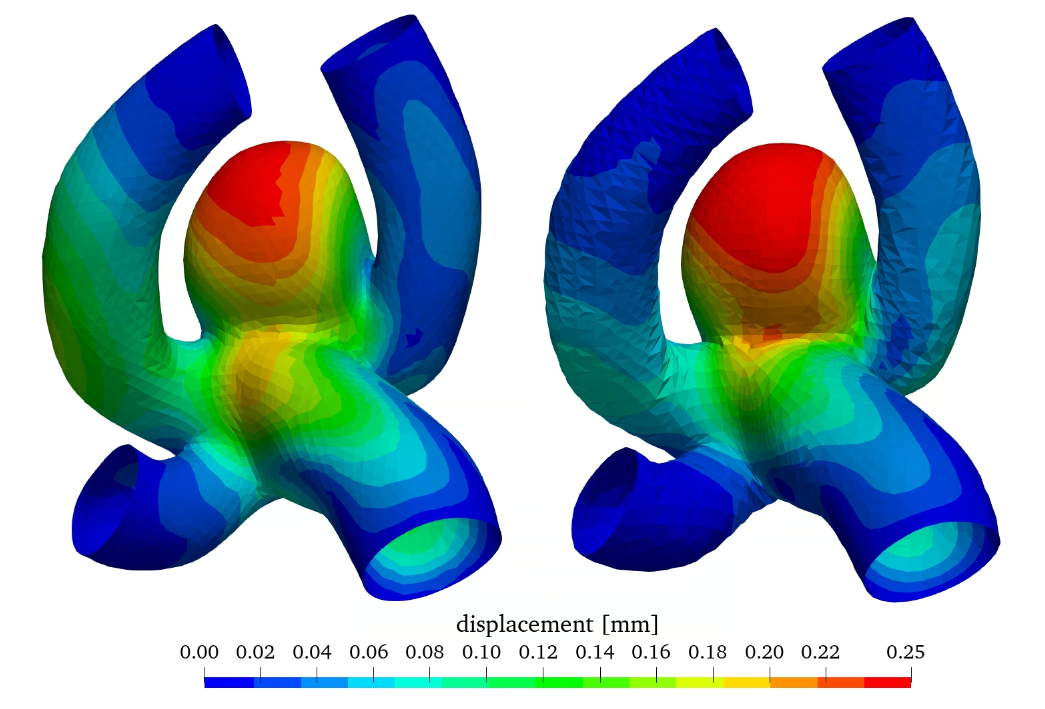
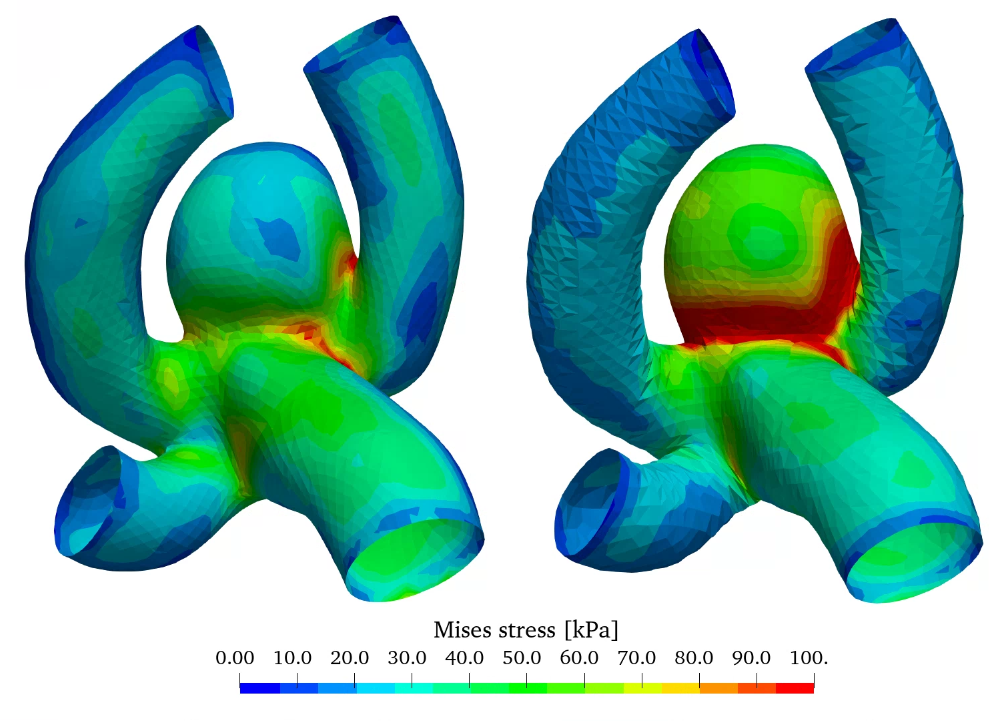
Figure 8 shows the wall displacement as well as the wall equivalent Mises stress. As expected from figure 2 (b) the displacement is overestimated by the linear elastic material model especially in the aneurysm sac in comparison with the non-linear model, as increased stresses don’t result in a linear increase of strain and dispalcement. The stress distribution is slightly elevated in the case of the non-linear elastic model, however the qualitative distribution is very similar.
 (a)
(a)
 (b)
(b)
The linear elastic model is adequately accurate for stress estimations, however for high stress/strain scenarios only the non-linear elastic model can be utilized for strain and displacement estimation.
4. 2. Influence of wall thickness
In addition, the workflow also enables the variation of the thickness of the aneurysm wall compared to the parent vessel. Here, the wall thickness of 0.3 mm is reduced to 0.15 mm in the aneurysm wall. The wall thickness in the parent vessel is kept at 0.3 mm. Results compared to the constant wall thickness of 0.3 mm are shown in figure 9, where the relative wall shear stress as well as the oscillatory shear index (OSI) can be seen (both models utilize the linear elastic material model).
Relative WSS and OSI show very similar behaviour in this comparison. The influence of wall thickness reduction is almost negligible.
 (a)
(a)
 (b)
(b)
Figure 10 shows the wall displacement as well as the wall equivalent Mises stress with constant and varying wall thickness. A reduction of wall thickness in the aneurysm considerably increases the stress in the wall increasing the potential risk for rupture. Therefore, the wall displacement is also increased.
With this additional option to investigate a varying wall thickness distribution an even better estimation of rupture behaviour can be achieved in future simulations, by using the most realistic thickness distribution [9].
 (a)
(a)
 (b)
(b)
5. Method implementation for clinical considerations
The presented workflow and results will be used for future clinical considerations of patients with unruptured cerebral aneurysms. Therefore, a software suite has been created for qualitative and quantitative interpretation of hemodynamics as well as structural mechanics.
With the help of a graphical interface, even users without detailed simulation background can set up and start simulations automatically.
Results can be visualized and qualitatively analysed for focal changes of hemodynamic and structural mechanic quantities. This enables medical personnel to identify low WSS and high OSI regions, which show increased tendencies for aneurysm growth. With the GUI, simulations can be run for annually generated medical data, and a patient history can be created. In case significant changes occur over years, adequate steps can be taken in the treatment of the patient.
In addition, data of over 400 patients will be processed in a future step and simulations will be run. With this it is possible to create a statistical evaluation of hemodynamic and structural mechanic quantities. This way ruptured aneurysms can be statistically compared to stable aneurysms and statistically relevant quantities can be identified, which can be used for rupture risk estimation.
From a clinical point of view, technical advances that allow routine rupture risk prediction in patients with unruptured cerebral aneurysms are highly warranted. Most importantly, this software should be “self-explaining” so that the neurosurgeon can easily use it in his daily routine.
6. Conclusions
In this work a simulation method is presented to model the combined FSI behaviour of hemodynamics and structural mechanics of cerebral aneurysms. Using this method, the analysis of the local distribution of different quantities is possible. Furthermore, clinically relevant behaviour like aneurysm growth or rupture may be estimated.
In addition, simulation results were validated with experiments in order to guarantee the validity of the presented method.
For rupture estimation, in future steps a statistic evaluation of image data over 400 patients will be conducted to identify statistically significant quantities, which can help separate ruptured (or close to rupture) aneurysms from stable aneurysms.
An intuitive GUI is being developed for medical personnel (especially neurosurgeons) without special simulation background to automatically run simulations and evaluate results.
Acknowledgements
This work was generated in the projects financed by research subsidies granted by the government of Upper Austria and funded by the FFG (Austrian Research Promotion Agency) under the grant 872604 (MEDUSA) and FO999895610 (ARES).
References
[1] B. Klaus and P. Horn, Robot Vision. Cambridge, MA: MIT Press, 1986.
[2] S. Dhar, M. Tremmel, J. Mocco, M. Kim, J. Yamasolo, A . H. Siddiqui, L. N. Hopkins and H. Meng, "Morphology Parameters for Aneurysm Rupture Risk Assessment" Neurosurgery, vol. 63, no. 2, pp. 185-197, 2008. View Article
[3] S. Jirjees, Z. M. Htun, I.. Aldawudi, P. C. Patwal and S. Khan, "Role of Morphological and Hemodyanmic Factors in Predicting Intracranial Aneurysm Rutpure: A Review" Cureus, vol. 12, no. 7: e9178, 2020. View Article
[4] H. Meng, V.M. Tutino, J. Xiang, and A. Siddiqui: "High WSS or Low WSS? Complex Interactions of Hemodynamics with Intracranial Aneurysm Initiation, Growth, and Rupture: Toward a Unifying Hypothesis" AJNR Am. J. Neuroradiol., vol. 35, no. 7, pp. 1254-1262, 2014. View Article
[5] Japan Investigators UCAS, A. Morita, T. Kirino, K. Hashi, N. Aoki, S. Fukuhara, N. Hashimoto, T. Nakayama, M. Sakai, A. Teramoto, S. Tominari and T. Yoshimoto, "The natural course of unruptured cerebral aneurysms in a Japanese cohort". N Engl J Med, vol. 366, pp. 2474- 2482, 2012. View Article
[6] P. Jiang, Q. Liu, J. Wu, X. Chen, M. Li, Z. Li, S. Yang, R. Guo, B. Gao, Y. Cao and S. Wang, "A Novel Scoring System for Rupture Risk Stratification of Intracranial Aneurysms: A Hemodynamic and Morphological Study". Front. Neurosci. vol. 12, no. 596, 2018. View Article
[7] F.J. Detmer, B.J. Chung, F. Mut, M. Slawski, F. Hamzei-Sichani, C. Putman, C. Jimenez and J.R. Cebral, "Development and internal validation of an aneurysm rupture probability model based on patient characteristics and aneurysm location, morphology, and hemodynamics". Int J CARS, vol. 13, pp. 1767-1779, 2018. View Article
[8] F.J. Detmer, B.J. Chung, F. Mut, M. Slawski, F. Hamzei-Sichani, C. Putman, C. Jimenez and J.R. Cebral, "Development of a statistical model for discrimination of rupture status in posterior communicating artery aneurysms". Acta Neurochir, vol. 160, pp. 1643-1652, 2018. View Article
[9] S. Soldozy, P. Norat, M. Elsarrag, A. Chatrath, J.S. Costello, J.D. Sokolowski, P. Tvrdik, M.Y.S. Kalani and M.S. Park. "The biophysical role of hemodynamics in the pathogenesis of cerebral aneurysm formation and rupture". Neurosurg Focus. Vol. 47, no. 1, pp. E11. 2019. View Article
[10] J. M. Acosta, A. F. Cayron, N. Dupuy, G. Pelli, B. Foglia, J. Haemmerli, E. Allermann, P. Bijlenga, B. R. Kwak and S. Morel, "Effect of Aneurysm and Patient Characteristics on Intracranial Aneurysm Wall Thickness", FRONT CARDIOVASC MED, vol. 8, Article 775307, 2021 View Article
[11] J.R. Cebral, F. Mut, D. Sforza, R. Löhner, E. Scrivano, P. Lylyk, C. Putman, "Clinical application of image-based CFD for cerebral aneurysms". Int. j. numer. method. biomed. eng., vol. 27, pp. 977-992, 2011. View Article
[12] T.C. Gasser, M. Auer, F. Labruto, J. Swedenborg, J. Roy, "Biomechanical rupture risk assessment of abdominal aortic aneurysms: Model complexity versus predictability of finite element simulations". Eur. J. Vasc. Endovasc. Surg., vol. 40, pp. 176-185, 2010. View Article
[13] C. Reeps, M. Gee, A. Maier, M. Gurdan, H.H. Eckstein and W.A. Wall, "The impact of model assumptions on results of computational mechanics in abdominal aortic aneurysm", J. Vasc. Surg., vol. 51, pp. 679-688, 2010. View Article
[14] H.G. Weller, G. Tabor, H. Jasak, and C. Fureby. "A tensorial approach to computational continuum mechanics using object orientated techniques", Comput. phys., vol. 12, no. 6, pp. 620 - 631, 1998. View Article
[15] P. Cardiff, A. Karač, P. De Jaeger, H. Jasak , J. Nagy, A. Ivanković and Ž. Tuković: "An open-source finite volume toolbox for solid mechanics and fluid-solid interaction simulations", arXiv:1808.10736v2, 2018, available at https://arxiv.org/abs/1808.10736
[16] J. T. Oden, Mechanics of Elastic Structures, New York, McGraw-Hill, 1967.
[17] F. Lorenzetti, S. Suominen and E. Tukianen, "Evaluation of Blood Flow in Free Microvascular Flaps", J. Reconstr. Microsurg. Open, vol. 17, no. 3, pp. 163-167, 2001. View Article
[18] P. Blanco, L. Müller and J. David Spence: "Blood pressure gradients in cerebral arteries: a clue to pathogenesis of cerebral small vessel disease", Stroke Vasc. Neurol., vol. 2, no. 3, pp. 108-117, 2017. View Article
[19] B. K. Toth, "The mechanical interaction between the red blood cells and the blood vessels", Ph.D. dissertation, University of Budapest, 2011.
[20] M. Wimmer, "Experimental Analysis of Artificial Cerebral Blood Vessels", Master's Thesis, Institute of Polymer Product Engineering, Johannes Kepler University Linz, 2021.