Journal of Biomedical Engineering and Biosciences (JBEB)
ISSN: 2564-4998

Volume 10 - Year 2023 - Pages 01-04
DOI: 10.11159/jbeb.2023.001
A Simulation Study of Urine Transport Through the Ureter
Poupak Kermani
McGill University
Montreal, Quebec, Canada
poupak.kermani@mail.mcgill.ca
Abstract - This paper presents a mathematical model that explains the mechanism behind the drainage of urine from a healthy human kidney through the ureter. Computer simulation is used to study the conduction velocity and output flow rate of a urine bolus through the Ureter lumen. The conduction velocity calculated by the simulation model is 4.8 cm/sec which is in within the range of experimental values of 2 to 6 cm/sec. The urine output flow rate is calculated to be 0.053 ml/sec, which results in a total of 1.8 liter of urine disposition from two kidneys every 24 hours. The simulation result yields toward the nominal quantity of 1.5 liter of urine disposed by a healthy adult with normal kidney function.
Keywords: Peristalsis, Conduction velocity, Urine output rate.
© Copyright 2023 Authors This is an Open Access article published under the Creative Commons Attribution License terms. Unrestricted use, distribution, and reproduction in any medium are permitted, provided the original work is properly cited.
Date Received: 2023-02-22
Date Revised: 2023-04-10
Date Accepted: 2023-04-28
Date Published: 2023-06-19
1. Introduction
The passage of urine through the ureter’s lumen is derived by successive waves of active muscular contraction that pass along its walls from the kidney to bladder. In between contraction waves the muscle of ureteral wall is relaxed [1]. This phenomenon is called Peristalsis. The Peristalsis is initiated at the renal pelvis following the pacemaker effect generated by the synchronized and rhythmic activity of the sum of action potentials initiated by each nephron [2]. An action potential is an electric signal that is created from a temporary shift from negative to positive potential of a nephron membrane.
Peristalsis controls the urine flow. Under normal flows, the urine between two contractions waves takes the form of a bolus. The rhythmic contractions of the ureter wall push through the ureter’s lumen, the bolus of urine. The mean rate of flow of urine through the ureter is equal to the rate.
The ureter is a smooth tubular muscle, which transports urine from the Kidney’s pelvis to the bladder. The passage of urine through the ureter’s lumen is regulated by the rhythmic contractions of the ureter walls, which pushes the bolus of urine through its lumen. This phenomenon, which is called the Peristalsis, exercises consistently luminal pressure which occurs behind the urine bolus during its passage through the ureter [3].
The muscular contraction force which travels through the ureter’s walls and regulates the transport of the urine bolus, is difficult to measure experimentally. The peristaltic movement of the ureter is a complex phenomenon, which is difficult to replicate accurately with a computational model.
The purpose of this paper is to present a mathematical model which is based on the difference of pressure created inside the ureter’s lumen during the ureteral peristalsis. This model allows to compute the urine output flow rate in a healthy person.
2. Simulation Method
2.1 Assumptions
The kidney is prototyped as a homogeneous volume conductor propagation model. It is considered as an electric load affecting the propagation of the "pacemaker" action potential through the ureter. The Electrical characteristic of the kidney’s pelvis is represented in a bulk format. The urine is transported from the kidney’s pelvis through the ureter’s lumen by the action of pperistalsis and muscular contraction of the ureter wall. This mechanism is modelled as an Electro-mechanical pump whose action is triggered at the pyelo-ureteral junction (UPJ) when the frequency of peristaltic contractions reaches that of the pacemaker, the ureter assumes the form of an open duct. It is assumed that the power generated by the Electro-mechanical pump is a result of the pacemaker effect at UPJ. During the polarization phase of the peacemaker activity, it is assumed that the UPJ is switched opened to let the urine bolus to be evacuated.
The ureter is prototyped as a cylinder with circular cross section. The ureter is considered to be positioned horizontally. One end of the ureter is connected to the Kidney’s pelvis and the other end to the bladder. The urine is considered to be an incompressible fluid.
It is assumed that the conduction velocity of urine is governed by the Peristalsis. The velocity of the bolus of urine is considered to be at its maximum value at the pyelo-ureteral junction (UPJ). This velocity decreases to zero once the bolus of urine reaches the junction between the ureter and the bladder.
2.2 Mathematical Model
The mechanical power required to move a bolus of urine through the ureter, is equal to the electric power generated at the Kidney’s pelvis (Equation 1).

Where Φ is the Sum of Action Potentials at UPJ, R is the lump Resistance at UPJ, m is the mass of a urine bolus, m= ρ * V, ρ is the density of Urine at 37℃, V is the volume of a bolus, g is the gravitational acceleration.
The volumetric flow of the bolus of urine through the ureter’s lumen is derived using the Poiseuille’s law, in concert with the Bernoulli’s equation (Equation 2).
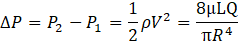
Where Δp is the pressure difference between the two ends of the ureter, µ is he dynamic viscosity of urine at 37℃ , L is the length of the ureter, Q is the volumetric flow rate of a bolus of urine, R is the radius of the ureter, ρ is the density of Urine at 37℃.
2.3 Model Simulation and Parameter Estimation
In order to simulate the effect of the pacemaker, a simulated synthetic wave is used that imitates the morphology of a renal action potential. According to J.R. Cotton [4] the Kidney Membrane Action Potential at rest, is -91 mV. There is a slow upstroke velocity of 1 V/sec and an overshoot to approximately +30mV, with an Action Potential duration of approximately 1 sec [5]. Waves are generated in the intervals of 10 to 60 seconds [1]. The whole renal pelvis acts as a pacemaker to generate all or none propulsion of urine [5]. When the frequency of peristaltic contraction reaches that of the pacemaker, the UPJ assumes the form of an open duct [5] and bolus of urine travels through the ureter at a velocity ranging between 2 to 6 cm/sec [2]. Figure 1 is a simplified representation of the renal pacemaker, calculating the conduction velocity of urine bolus through the ureter’s lumen, based on above assumptions.
According to The Foundation for Research on Information Technologies in Society (IT'IS) database [6], the ureter electric conductivity could be estimated as 0.462 S/m. Assuming that the ureter has a diameter of 5.85 mm [7], the lump resistance at UPJ could be estimated to be 370 Ω. The combination of renal cortex and the renal medulla cold be estimated to be 1132 Ω. Assuming that a normal human being consumes 2 litters of water in 24 hours, the mean value of a bolus of urine per kidney could be estimated to be 1.16 x10⁻⁸ [m3/sec]. The density of urine at 37oC is estimated to be 1.05 [g/cm3] [8].
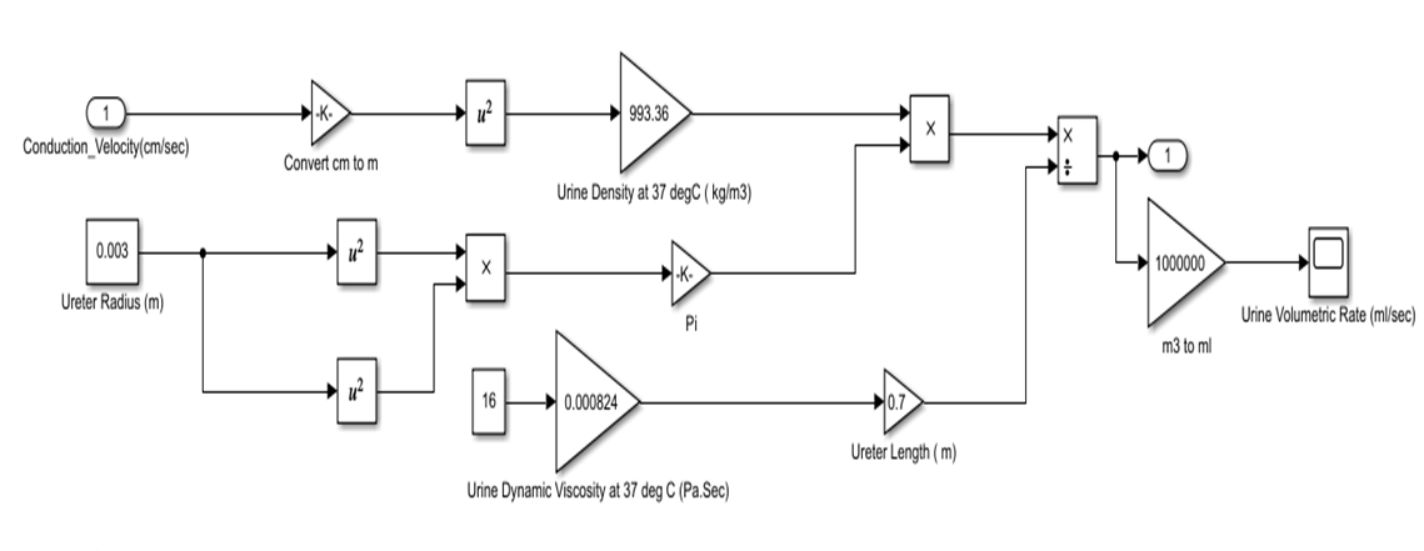
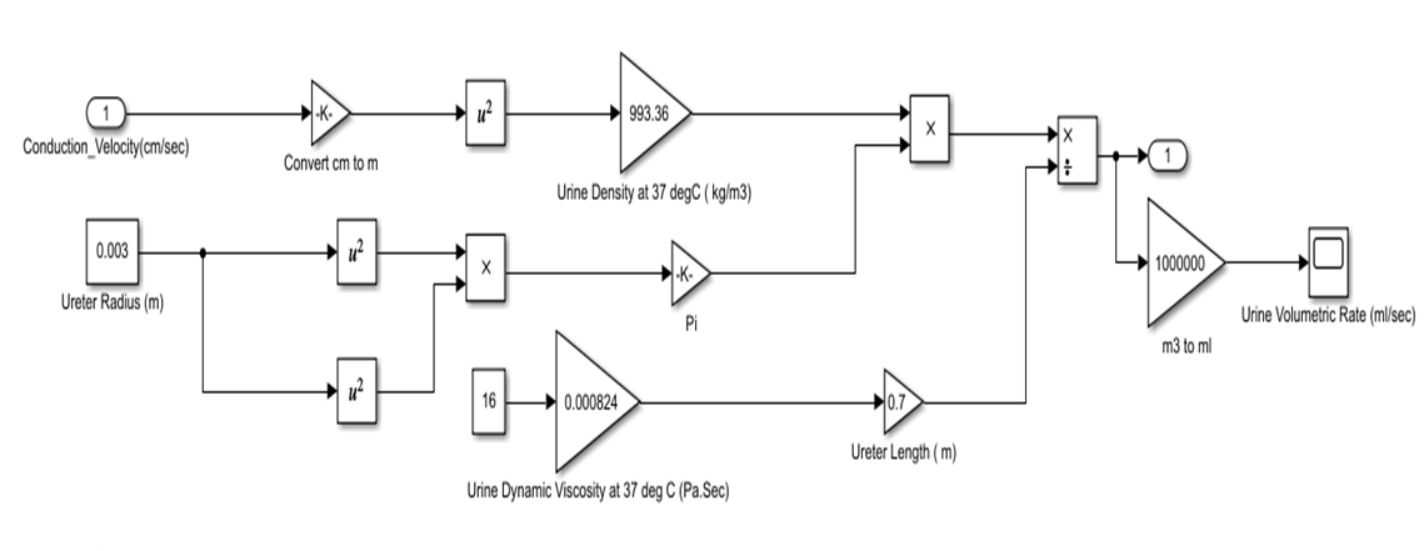
Figure 2 shows a simulation representation of Equation (2), used to compute the urine output rate flow through the ureter’s lumen. For this simulation, the ureter is considered to be of 70 cm long with a circular cross section of 3 mm in radius [9]. The dynamic viscosity of the urine at 370C is considered to be equal to 0.000824 Pa.Sec [10]. The density of urine at 370C is considered to be equal to 993.36 kg/m3 [10]. The computed velocity of the bolus of urine is estimated to be equal to 4.8 cm/sec.
3. Results
Figure 1 represents a simplified version of the renal pacemaker, which uses a synthetic action potential signal.
Figure 3 shows the behavior of the synthetic action potential signal, which is responsible for the initiation of pacemaker activity at UPJ. This signal starts at -91 mV and reaches +30mV in one second. The Action Potential duration is of 1.5 seconds, and waves are generated every 5 seconds. The synthetic action potential signal shows the same morphology as data obtained experimentally [5]. However, the refractory period between two action potential waves is two to twelve times longer in experimental data, ranging between 10 to 60 seconds. It could be assumed that measurement errors during experimentation could explain this discrepancy.
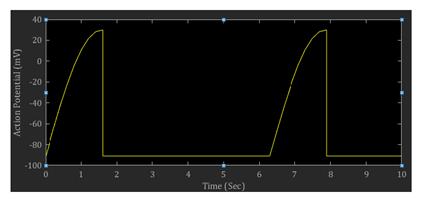
Figure 4 shows the simulated conduction velocity of a urine bolus travelling through the ureter’s lumen, obtained from the simulation of the Electro-mechanical pump model, which represents the Kidney’s pacemaker activity. The simulated value is calculated to be +4.8 cm/sec which is quite in within the range of 2 to 6 cm/sec obtained experimentally [2].
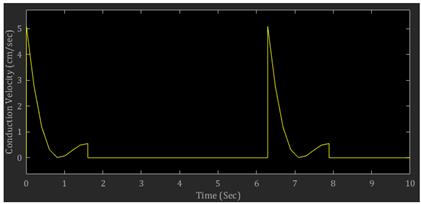
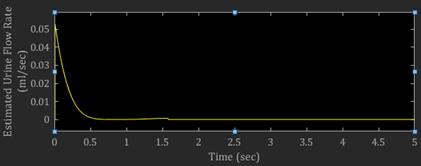
Figure 5 shows the computed urine output rate during one cycle of uureteral peristalsis. Each cycle of peristalsis which travels across the ureteral walls, will transport 0.053 ml/sec of urine, through the ureter’s lumen. When repeating the ureteral peristalsis’ cycle during 24 hours, a total volume of 915.84 milliliter of urine will be passed from the kidney’s pelvis to the bladder. A person with normal kidney function should dispose the nominal quantity of 1.5 liter of urine every 24 hours. This model predicts a total of 1.8 liter of urine disposition from two Kidneys every 24 hours. Assuming the person is at rest and there is no other source of fluid loss, the simulation result of this study yields toward the urine disposition of a healthy adult with two normal Kidney function, performing normal daily activities.
4. Discussion
The present study has used simple mathematical modelling and computer simulation in order to compute the conduction velocity of urine transport through the ureter in a healthy human being. The kidney was represented as a homogenous medium with a constant temperature, density and conductivity. The complex electro-physiology of the kidney responsible for the peristalsis was represented by an electro-mechanical pump placed at the junction between the kidney and ureter. The simulation results showed consistency with respect to experimental data.
The ureteral contraction force, leading the passage of urine through the ureter’s lumen, is difficult to measure experimentally, and quite complex to be modelled mathematically. The present study has focused on the footprint of the ureteral peristalsis, which is the pressure difference inside the ureter’s lumen behind every movement of the bolus of urine. The mathematical model based on Poiseuille’s law and Bernoulli’s equation allowed the calculation of the urine output flow rate for a normal kidney function.
5. Conclusion
Human kidney is a vital organ with complex characteristics. Studying its physiology using experimentation could be proven difficult and costly. Mathematical modelling and computer simulation, in conjunction with reasonable and rational assumptions, are tools that could be used in order to describe and study human kidney physiology with acceptable accuracy and minimal cost.
References
[1] Richard J. Lang , Margret E. Davidson and Betty Exintaris, "Pyeloureteral motility and ureteral peristalsis: essential role of sensory nerves and endogenous prostaglandins," Journal of Experimental Physiology, January 2002, Pages: 129 to 146. View Article
[2] Robert M. WEISS, Frank J. TAMARKIN and Marcia A. WHEELER, "Pacemaker activity in upper urinary tract," J. Smooth Muscle Res. (2006) 42(4), Pages: 103-115. vol. 3, pp. 771-775. View Article
[3] G. Hosseini, C. Ji, D. Xu, M. A. Rezaienia, E. Avital, A. Munjiza3, J. J. R. Williams, J. S. A. Green, "A computational model of ureteral peristalsis and an investigation into ureteral reflux, " Biomed. Eng. Lett. (2018) 8:117-125R. View Article
[4] James R. Cotton, Terry Woodard, Norman W. Carter, and James P. Knochel, "Resting Skeletal Muscle Membrane Potential as an Index of Uremic Toxicity. A PROPOSED NEW METHOD TO ASSESS ADEQUACY OF HEMODIALYSIS," J Clin Invest, 1979 Mar; 63(3): 501-506.B. View Article
[5] Kyung-Wuk Kim, Young Ho Choi, Seung Bae Lee, Yasutaka Baba, Hyoung-Ho Kim, and Sang-Ho Suh, "Analysis of Urine Flow in Three Different Ureter Models. Computational and Mathematical Methods in Medicine," Volume 2017, Article ID 5172641, 11 Pages. View Article
[6] ITIS Fondation, Tissue Properties [Online]. Available: https://itis.swiss/virtual-population/tissue-properties/database/dielectric-properties/
[7] Anthony J. Schaeffer, Michael P. Kurtz, Tanya Logvinenko, Michael T. McCartin, Sanjay P. Prabhu, Caleb P. Nelson, and Jeanne S. Chow, "MRI-based reference range for the renal pelvis anterior-posterior diameter in children ages 0-19 years," Br J Radiol, November 2016; 89(1067). View Article
[8] Mihaela Pop, Sean A.H. Davidson, Mark Gertner, Micahel A.S. Jewett, Michael D. Sherar, Michael C Kolios, "A Theoretical Model for RF Ablation of Kidney Tissue and Its Experimental Validation," International Symposium on Biomedical Simulation, ISBMS 2010, Biomedical Simulation, Pages: 119-129. View Article
[9] Harold C, SchottII, J. Brett Woodie, "Kidneys & Ureters," Equine Surgery (Fifth Edition), Chapter 65, 2019. View Article
[10] Brant A. Inman, Wiguins Etienne, Rainier Rubin, Richmond A. Owusu, Tiago R. Oliveira, Dario B. Rodriques, Paolo F. Maccarini, Paul R. Stauffer, Alireza Mashal, and Mark W. Dewhirst, "The impact of temperature and urinary constituents on urine viscosity and its relevance to bladder hyperthermia treatment," Int J Hyperthermia, 2013; 29(3): 206-210. View Article